By Ken Martin, JLL
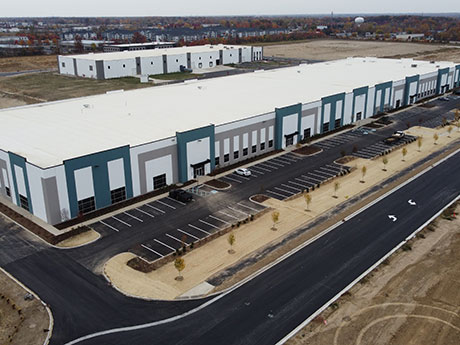
The Indianapolis industrial real estate market ended 2022 nearing a record high for a single year with more than 19.6 million square feet of absorption. Much of this was recorded in Hendricks, Johnson and Hancock counties with total year-end net absorption of 7.3, 6.4 and 3.2 million square feet, respectively.
These submarkets continue to offer tenants excellent access to both interstate highways to transport goods across the country, as well as strong employment bases. Developers and tenants often cite employment bases as their No. 1 criteria in selecting an optimum site.
With vacancy at an all-time low of sub 5 percent for the majority of 2022, developers and owners were able to push rents as demand outstripped supply. As recently as two to three years ago, rents were consistently in the high $3’s per square foot range and now we consistently see rents in the $5 per square foot range or higher.
Year-end asking rents averaged $5.54 per square foot overall and $6.48 per square foot for mid-sized warehouse space.
In some markets, however, rents for warehouse space were well above the average. In the central business district, for example, asking rates for warehouse space averaged $8.43 per square foot, followed closely by North/Northeast Marion County at $8 per square foot.
The markets with the highest overall average asking rents were West/Southwest (Marion County) at $7.26 per square foot, Northwest (Marion County) at $7.21 and Hamilton County at $7.02. In addition, all three of these areas combined have roughly 854,000 square feet of new construction scheduled for delivery in the coming year, which should keep rents on the high side in 2023.
Between January and December, nearly 25 million square feet of new product was added to the market base. This level of construction caused total availability to increase from 10.4 percent at the end of the third quarter to 11 percent at year-end. In turn, vacancy rates rose from 4.2 percent to 5.4 percent. While somewhat high, the current vacancy rate is well below Indy’s historical average of 7 percent.
West/Southwest (Marion County) recorded the lowest vacancy rate at just 0.2 percent, followed closely by North/Northeast (Marion County) at 0.7 percent and Northwest (Marion County) at 0.9 percent.
In terms of development, there is an additional 22.1 million square feet in the pipeline and scheduled for delivery in 2023 — much of which is speculative. The bulk of the new construction can be found in the Hancock (6.5 million square feet), Boon (5.6 million), Hendricks (4.4 million) and Johnson (3.5 million) county submarkets.
With more than 7 million square feet delivered between January and December, Hancock County currently has 35.3 percent available inventory and a whopping 23.3 percent vacancy rate. The additional 6.5 million square feet of new construction will clearly add to the supply/demand imbalance in this submarket.
The silver lining to the existing construction activity and its direct correlation to available square footage is that the lack of available construction loan capital will curtail massive overbuilding in 2023. Banks have controlled the funding of new construction loans by exiting the market all together, or in the case of those still lending, by implementing higher pricing, lower proceeds or a combination of both. This constraint on lending has had a direct effect on developers’ decisions to move forward with new projects.
Overall investment activity
With both private and institutional capital continuing to flock to the industrial space, the Indianapolis industrial market had a record fourth quarter in 2021 that saw over $1.5 billion (per RCA) of industrial property trade hands. Continuing into early 2022, the first and second quarters saw trades of industrial property totaling $1.2 billion, a 76 percent increase over the first and second quarters of 2021. Along with record-setting volumes came record-setting cap rates, with some properties trading with cap rates that started with a 3.
However, as interest rates began to rise at the end of the second quarter of 2022 and continued to rise throughout the year, investors started to rethink their investment strategies related to real estate and as a by-product there quickly developed a bid-ask gap between buyers and sellers. This bid-ask gap caused many potential sales to be pushed off into 2023 or later. The lack of sales is reflected in the market volume for Indianapolis, which totaled $880 million for the third and fourth quarters of 2022, off 155 percent from the same time period in 2021.
Looking forward
Uncertainty in the overall economy will cause some businesses to move more cautiously in the next 12 months as tenants continue to look to right size their demand needs in the market.
On the supply side of the market, given the lack of available construction loan capital during the latter part of 2022 and in 2023, new construction starts are being limited. This limited new construction will help create a scenario where with normalized tenant demand, the existing projects under construction and those recently completed will fill up, positively affecting the vacancy rate in the market.
As we have turned the page to 2023, investors are adjusting to the new normal of where cap rates and rents are today. Those with capital ready to deploy understand the current cost of their capital and are ready to go on the offensive to add to their portfolios. While likely not a record year for transactions like 2021, 2023 could see significant capital deployment in Indianapolis when sellers and buyers come together and eliminate the bid-ask gap that existed for much of the back half of 2022.
Ken Martin is a senior managing director with JLL Capital Markets. This article originally appeared in the February 2023 issue of Heartland Real Estate Business magazine.


