Lee & Associates’ newly released 2023 Q2 North America Market Report outlines industrial, office, retail and multifamily outlooks trends in the United States. This sector-based review of commercial real estate trends for the second quarter of the year examines the difficulties facing each property type and where opportunities in the landscape may be emerging.
Troubles with absorption dogged each sector, with the exception of retail, throughout the first half of 2023. Scheduled deliveries for industrial, office and multifamily indicate this trend will continue throughout much of the United States for the foreseeable future.
Lee & Associates has made the full market report available here (with further breakdowns of factors like vacancy rates, market rents, inventory square footage and cap rates by city). The summaries from each sector below provide high-level considerations of the overall outlook and challenges in the market.
Industrial Overview: Industrial Growth on Track for Least Gain in Years
In a reversal from the ballooning logistics capacities required during the pandemic, demand for industrial space has slowed across North America. After continuously rebuilding inventories from the fall of 2021 through the third quarter of last year, many retailers and wholesalers are taking a breather, pausing further inventory accumulation out of caution over the economic outlook. In the U.S., second-quarter net absorption was down 58 percent year over year, and 2023 is on track to post the weakest annual growth in more than a decade. The vacancy rate was up 30 basis points from the first of the year to settle at 4.7 percent. The recent slowing has been broad based across most markets, but Los Angeles, the Inland Empire and Las Vegas recorded outsized increases in available space.
U.S. imports have fallen from record highs in November. The slowdown has been most pronounced at the Port of Los Angeles, where cargo traffic was affected by China’s Covid wave in late 2022 and early 2023. Additionally, until a tentative labor agreement was reached recently, there has been risk of a strike by West Coast dockworkers who have been working without a contract since 2022. That risk was enough for many importers to divert cargoes to major East Coast ports such as Newark, Savannah, Norfolk and Charleston as well as Houston.
Bucking the national trend are several markets, notably Lehigh Valley, Richmond, Tampa, Jacksonville, Detroit and Reno, that have reported tightening availability since mid-2022. Contributing to the weak growth were troubled retailers such as Neiman Marcus, Bed Bath & Beyond and Stich Fix, which shuttered distribution centers larger than 500,000 square feet. Amazon recently put its 508,000-square-foot distribution center outside Baltimore on the market along with a similar facility in Broward County, Florida.
While the resumption of student loan payments and a possible recession could result in a pullback in consumer spending, the onshoring of high-tech manufacturing is likely to be a driver of U.S. absorption through 2026. The CHIPS and Science Act and Inflation Reduction Act okayed more than $400 billion in incentives for new U.S.-based high-tech manufacturing. More than 30 battery plants are planned, and many are targeting 2024-25 to start production. Many of these plants are planned in Georgia, Arizona and Texas.
The stock of U.S. industrial properties is set to grow by nearly 4 percent this year, the fastest pace in more than three decades. But barring a severe economic shock, the amount of space under construction will likely produce only a moderate increase in vacancy. Construction starts have been plummeting since last fall. Developers have grown increasingly concerned that higher interest rates are causing values of newly delivered projects to dip below replacement costs.
Office Overview: Office Downturn Deepens, Sublease Space Mounts

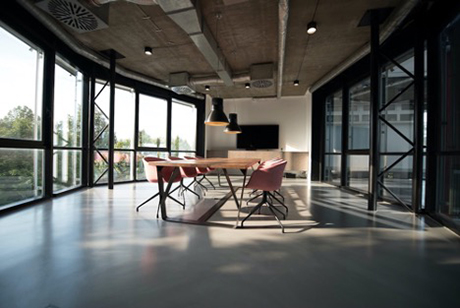
Photo by Nastuh Abootalebi on Unsplash.
Tenants in the United States shed a record amount of space in the first half of 2023 and net absorption is on pace for its biggest annual loss ever, exceeding the negative 68 million square feet in 2020, the first year of the pandemic. Net absorption nationwide in the second quarter was negative 10.9 million square feet, bringing the mid-year total to negative 39.7 million square feet, as the internet and social distancing combined to dramatically alter the entrenched regimen of the office worker. While hybrid work has become a fixture in many companies, studies show that fully remote work has declined.
Top-quality buildings have seen consistently positive net absorption throughout the pandemic era. So have newer buildings, completed after 2015. Leasing data shows that since the beginning of 2022, tenants have been taking nearly 10 percent less space since before the pandemic. The U.S. market has contracted by 150 million square feet over an unprecedented three straight years beginning early in 2020 when the vacancy rate was 10 percent or 2 percent of total inventory.
The vacancy rate at the end of the second quarter of this year was 13.2 percent and short- and long-term pressures are lined up to drive it higher. For example, new leasing activity this year has been off 17 percent from its pre-pandemic average. Also, about 67 million square feet of new inventory – the most since 2009 – is projected for delivery by the end of the year.
With 65 percent of leases set to expire in the next five years, an imminent turnaround is unlikely. Also, the amount of available sublease inventory has soared to 216 million square feet, a 120 percent increase since the end of 2019.
Sublease space is the proverbial canary in the coal mine and can signal an extended period of weak demand. Conditions in San Francisco are acute. The city has 13 million square feet available for sublease, representing 6.7 percent of total inventory. New York City’s 30 million square feet of sublease space is equal to 3 percent of inventory. Even more resilient markets have been hit by the sublease wave. San Jose and Austin, for example, each have more than 6 million square feet of sublease space available.
Taken together, depressed occupancy and second-hand space have created a demand gap of more than 400 million square feet, rivaling the size of office markets in Dallas or Los Angeles. Demand has been comparatively healthier in several secondary and Sun Belt markets, including Miami and Las Vegas.
Maturing debt looms as a challenge. More than $24.5 billion in CMBS office loans will come due this year. Delinquency rates are up 2.4 percentage points since December and are projected to reach 6 percent or more next year.
Retail Overview: Retail’s Latest Challenge — Satisfying Pent-Up Demand

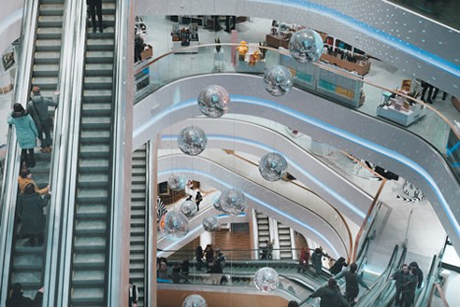
Photo by Viktor Bystrov on Unsplash.
Retail property is showing its overall resilience across North America with fundamentals so tight that the sector’s biggest challenge lately is satisfying pent-up demand.
The second quarter was the ninth straight quarter of positive net absorption in the U.S. Leasing activity has been declining lately, however. This year’s 18.2 million square feet of net absorption through June is the least since 2020, the first year of the pandemic. Otherwise, most retail landlords have enjoyed steady growth, and the sector’s vacancy rate is at a record low 4.2 percent.
Merchants and landlords say leasing activity is being affected by supply- and demand-side factors. Lack of available supply in desirable locations is holding back growth while concerns over rising costs and uncertain economic outlook for consumption are affecting demand.
Most leasing activity remains concentrated in smaller spaces, less than 3,000 square feet, and is being driven by growth in store counts from quick-service restaurant brands such as Starbucks, Crumbl Cookies, Yum Brands and Restaurant Brands International, which owns BK, Tim Hortons, Popeyes and Firehouse Subs. T-Mobile and AT&T also have leased dozens of small shop spaces over the past year.
Demand for medium to larger space has been chiefly driven by discounters TJ Maxx, Burlington, Dollar Tree, Dollar General and its new concept PopShelf. Demand for spaces larger than 10,000 square feet has come from fitness and experiential tenants, as consumers pivot back toward services in a post-pandemic environment. After accounting for between 8 to 10 percent of all retail leasing activity since 2015, experiential retailers total 15 percent of all retail activity for the past year with Planet Fitness and Urban Adventure topping the list.
While demand for space continues to rise, new retail development activity remains muted. A mere 51 million square feet of new space was delivered in the past 12 months, which is 35 percent less than the pre-pandemic average. At the same time, 21.5 million square feet have been demolished over the past year. In the last five years 144 million square feet have been razed. With concerns of over-supply still fresh in the minds of banks and developers, the majority of new space consists of build-to-suits and small freestanding buildings. Low supply and strong consumer spending have combined to drive nominal asking rents upward at their fastest clip in a decade. Average triple-net asking rents are up 3.5 percent and average $24 per square foot.
Multifamily Overview: Demand Rebounds but Tenants Retain Upper Hand

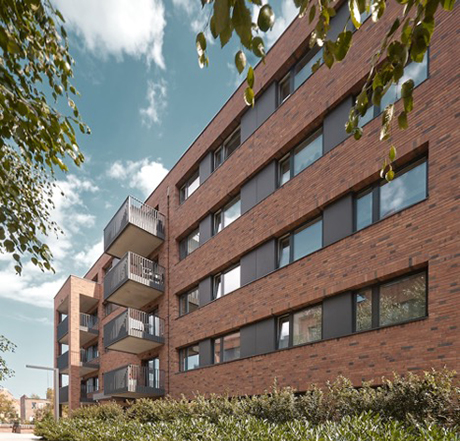
Photo by Maciej Drążkiewicz on Unsplash.
Healthy demand for apartments in the U.S. rebounded in the second quarter after falling flat last summer. But with supply outpacing net absorption for six straight quarters and a historic volume of apartments under construction the outlook tilts decidedly in the tenant’s favor.
There were 184,935 units rented in the first half of 2023, 24 percent more than last year, with 140,139 units absorbed in the second quarter. The strong quarterly showing puts absorption for 2023 on track to exceed the five-year pre-pandemic annual average by 15 percent.
The increased inventory of available units has put downward pressure on rents. Nationally, rent growth through the second quarter this year averages 1.1 percent, the lowest since 2020.
The strong second-quarter demand is a reversal from the weak net absorption going back to last summer. Net absorption only totaled 28,920 units in the second half of 2022 and the first quarter’s growth totaled 44,796 units, well below the 82,000 quarterly average for five years prior to the lockdown.
Northeast and Midwestern markets fared best for investors over the last four quarters with year-over-year rent growth down only marginally. For example, Saint Louis and Kansas City posted 5.7 percent rent growth in 2022, which remains significantly higher than each city’s five-year average. Madison, Knoxville, Rochester, Providence and Omaha were the growth leaders with effective rent increases ranging from 4.9 to 6.9 percent.
Unfortunately for landlords, the downward pressure on rents is expected to continue through 2023 and beyond. Sun Belt markets saw significant slowing over the past 12 months. Rents skidded in Las Vegas, Austin and Sarasota, ranging from 3.3 to 3.9 percent in the red at the end of the second quarter. Palm Beach saw the steepest rent slowdown in the nation, down nearly 30 percent over the past 18 months.
When multifamily demand spiked in the first year of the pandemic, developers accelerated plans for new projects. Now, two years later, many of these are set to deliver. This year nearly 530,000 new units are projected for completion. It will be the most new supply to hit the market since the mid-1980s. Sun Belt markets make up 12 of the 20 markets where deliveries are projected to hit records this year.
The recent supply-demand imbalance has pushed the national vacancy rate up at least 200 basis points from an all-time low of 4.7 percent in the third quarter of 2021 to 6.8 percent, which is slightly higher than the pre-pandemic average rate.
— Lee & Associates Research Department. Lee & Associates is a content partner of REBusinessOnline. To read all of 2023 Q2 North America Market Report, click here.
Industrial photo by Oleg Laptev on Unsplash.


