The end of the first quarter of 2025 saw market uncertainty in the face of new U.S. trade and tariff policies combined with an unclear geopolitical outlook, according to Lee & Associates’ 2025 Q1 North America Market Report. The effect of these concerns within the commercial real estate world are most evident in the industrial sector, which is also contending with oversupply and softening rent growth.
Development is slow across property types. Retail, despite high-profile store closures in early 2025, remains historically tight on space as years of underbuilding keep availabilities near record lows.
Office demand has stabilized in several major metros following years of contraction, though vacancy remains elevated. The pipeline of new construction is both drying up and favoring new types of tenants beyond traditional office spaces.
Multifamily is seeing strong tenant demand in certain markets despite a flood of new deliveries.
Lee & Associates has made their full market report available here (click through for detailed breakdowns and city-by-city information). The information below for the industrial, office, retail and multifamily sectors offers clarity on market-wide demand, rent growth trends and challenges likely to shape trajectories throughout 2025.
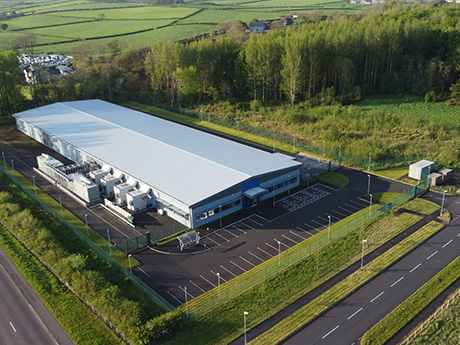
Industrial Overview: Soft Markets Face Tariff Disruptions
North America’s industrial markets are nearing the end of a wave of record development that – because of several quarters of weakened demand – has resulted in an oversupply of space and the lowest rent growth in years. Moreover, the sagging United States markets could suffer further disruption as they react to the United State’s controversial new trade and tariff regime.
U.S. net absorption in the first quarter totaled 9.5 million square feet and only 129.4 million square feet of growth in 2024 — the least since the great recession in 2010. Year-over-year rent growth has decelerated significantly over the past 12 months to 2.1 percent, which is less than half the five-year average before COVID.
Construction across North America is slowing. In the United States, quarterly net supply additions are on pace to fall below the pre-pandemic three-year average by midyear and continue declining through 2026 when supply growth is set to hit an 11-year low.
While new deliveries have peaked, several Sunbelt and Midwest markets with fewer development constraints are still posting a record supply of new space that could take more than two years to absorb. Austin, Indianapolis, Phoenix, Greenville/Spartanburg and San Antonio stand out as markets with risks of prolonged elevated availabilities, particularly among logistics buildings from 100,000 to 500,000 square feet.
Consumer spending eased in the first two months of 2025 while the launching of multiple trade wars simultaneously occurred. This risks derailing the key drivers of logistics leasing, including U.S. imports and inventories, which could cause true net absorption to underperform this year.
The stock of logistics properties 100,000 square feet and larger has grown 20 percent in the last four years. The vacancy rate among these buildings has surpassed 9 percent, the most since 2012. The small-space market remains a bright spot. Occupancy in buildings smaller than 50,000 square feet has fallen about 0.3 percent in the last 12 months. But because of chronically low levels of development of product in this range, the sub 4 percent vacancy rate is near pre-COVID record levels. Some of the most acute shortages of small space can be found in Nashville, Jacksonville, Orlando, Tampa and Charlotte.
Significant tariffs will force retailers to raise prices while increasing the likelihood that retailers will be hesitant to expand distribution networks until the threat of additional trade barriers dissipates.
Property sales totaled more than $65 billion in 2024, a 10 percent increase from the year before. Deal volume also gained momentum with 11,766 transactions, a 6 percent gain, which underscored a broader recovery in activity beyond just rising asset values. Institutional buyers stepped up acquisitions in the fourth quarter, particularly in deals greater than $50 million. While REITs remained net buyers, their activity was comparatively muted. Meanwhile, private equity firms returned to the market in the third quarter after nearly two years on the sidelines.

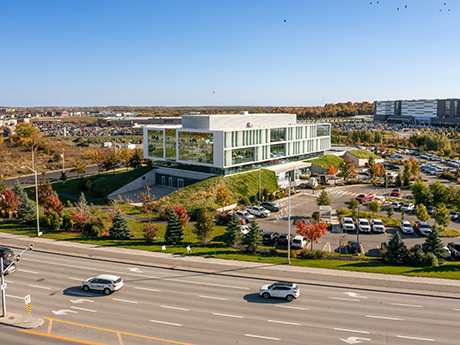
Office Overview: Market Recoveries Uneven; U.S. Posts Modest Gain
After showing signs of a continuing recovery with bosses backing away from the permissive pandemic workplace policies and remote work, the first quarter of 2025 opened with cautiously positive absorption outlook for the North American office market.
On the heels of posting 11.2 million square feet of net absorption in the last half of 2024, the U.S. office market opened the new year with positive, albeit weak, tenant growth of 482,271 square feet. It was a dramatic turnaround from the 26.8 million square feet loss of net absorption in the first quarter a year ago.
Much of the recent gain in the United States has come in New York City where users are scrambling for space to accommodate an uptick in attendance. Nationally, however, supply additions have kept the vacancy rate near a record high. While there are some signs the recovery could broaden throughout 2025, demand remains anemic in most major markets.
Tenant behavior in the post-COVID environment has become nuanced. Of the leases signed in 2024, the deals averaged 15 percent to 20 percent less space. Smaller users tend to upgrade their spaces while larger tenants tend to stay in place.
The supply pipeline is diminishing rapidly. The 67.1 million square feet underway is the least since 2012. Vacancy is expected to continue to climb through 2026, and rent growth should continue to decelerate prior to settling into a period of paltry growth of about 1 percent through next year.
Asking rents have remained flat for the last four years. At a $36-per-square-foot average, rents are about $1 per square foot more than rents entering 2020 — poor performance when consumer prices have risen 25 percent in the same period. Rents at five-star buildings, currently averaging $48 per square foot, still are slightly lower than in early 2020.
Supply growth slowed to a decade-low pace in 2024, a taste of things to come as the amount of new inventory slated to come to market in the rest of the decade drops massively. Less than 45 million square feet in new deliveries were completed in 2024, the least since 2012 and far less than the 10-year average of about 780 million square feet.
The pipeline also is qualitatively different. About 13 percent is medical office and 17 percent targeted top biotech users. Another 38 percent is being built for owner-users. Less than a third is composed of traditional for-lease office buildings, compared to nearly two-thirds of space completed in the last 25 years. The thaw in the U.S. office market has accelerated, unveiling a sector previously sidelined by investors. Transaction volumes, which regained momentum throughout 2024 and surged notably in the fourth quarter, continued their improving trend in the first quarter of 2025, recently finishing 31 percent higher year-over-year. This follows a 22 percent increase in total sales for 2024 compared to the cyclical lows of 2023.

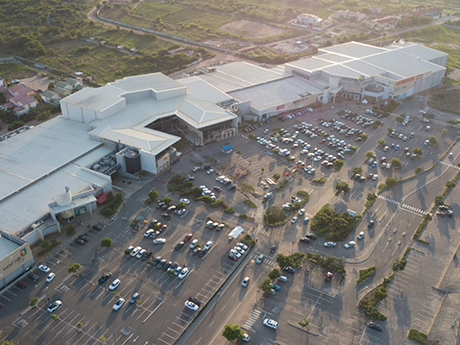
Retail Overview: Store Closures Belie Shortages of Space
Plans announced by merchants last year to shutter more than 8,700 stores produced the largest tenant contraction across North American retail markets since 2020. Nevertheless, vacancies remain at and near record lows.
U.S. retailers shuttered 7,089,219 square feet of space in the first quarter, which follows the net absorption of 23.1 million square feet in 2024, one of the weakest annual totals in a decade. Despite the sharp upturn in retailer bankruptcies and store closures, availability across U.S. retail space markets remains within 10 basis points of the historic low of 4.8 percent as new development is constrained. Deliveries for the five years prior to COVID were twice the total five years since the lockdown. In total, just 19 million square feet of retail space delivered since 2020 is available for lease across the United States.
A confluence of factors drove retail bankruptcies and store closures. After years of below-average closures the combination of rapidly rising costs, a challenging capital markets environment and significant competition from value and e-commerce retail forced certain retailers like Walgreens, Family Dollar and Advance Auto to close underperforming locations. It also pushed other large occupiers like Big Lots, Party City and Conn’s into bankruptcy.
The uptick in merchant failures also can be traced back to persistently low home sales, reducing the sales of furnishings, appliances, etc. Five of 12 retailers to shutter in 2024 operated in housing-dependent categories. But despite the increase in closures, an overwhelming majority of tenants continue to report a lack of quality available space and available space is backfilling at the fastest pace in nearly 15 years.
The reason for the current historically tight conditions has been the limited volume of new retail space delivered in recent years. In the five years prior to the lockdown, the annual average of newly completed space was 71 million square feet compared to 32 million square feet since 2020.
Retail sales, excluding e-commerce, gasoline and autos, have surged more than 30 percent on a nominal basis since the end of 2019. While inflationary pressures contributed to this growth, adjusted retail sales remain more than 10 percent greater than prior to the pandemic. In total, the amount of retail space occupied across the United States has increased by less than 2 percent since the end of 2019.
With the costs of development rising much faster than rents for the past 15 years, the economics of new retail development are exceedingly difficult to pencil in many locations. The net result is a market facing a significant shortage of available first-generation space at a time when dozens of large national tenants are looking to expand.

Multifamily Overview: Strong First Quarter Demand; Rebound Continues
There was continued strong demand for apartments across North America in the first quarter.
Net absorption in the United States in the first quarter of 2025 totaled 49,680 units, the largest quarterly volume since the pandemic gains of early 2021. Overall vacancy declined to 8.1 percent, snapping a 13-quarter rise. Large markets in the South and Southwest were the growth leaders.
The strong first-quarter performance in the United States, an increase of 61 percent over the same period a year ago, is a continuation of a growth rebound that began last year when 556,286 units were absorbed, the most in three years. Absorption was driven by stable economic growth plus a continued slowing of tenants making the jump to home ownership and creating fewer units to backfill.
The surge in U. S. tenant growth follows the biggest construction boom in decades, saturating the market with 1,270,222 new units over the last two years, equal to 6.3 percent of the total inventory. The 673,7687 units delivered in 2024 were the most in any year on record. While supply has outpaced demand over the past 12 quarters, the gap has closed significantly. This strong demand reflects continued release of pent-up household formations, especially in the mid-priced point properties.
While demand for apartments is growing at an above-average pace, the development cycle has peaked and is poised to wind down quickly over the upcoming year. Net deliveries have already declined for three consecutive quarters, falling nearly 30 percent to 123,000 units in the first quarter of 2025. Fewer apartments will reach completion as the year progresses, with the forecast falling below 70,000 units by the fourth quarter based on a thinning construction pipeline. Construction starts have fallen to a decade-plus low due to extended lease-up periods developers are experiencing, higher capital costs and stricter lending.
While vacancies have surged in the South and Southwest due to oversupply, most Midwest and Northeast markets have seen only moderate supply increases, leading to more balanced fundamentals and favorable rent growth in those regions. In contrast, rents have fallen in markets across states in the South, Arizona and Texas. Vacancy is highest in Austin and San Antonio among the 50 largest markets, with Austin’s reaching over 15 percent in 2024 and Class A vacancies exceeding 17 percent.
However, vacancies in the Texas markets peaked in recent quarters, following Jacksonville, Raleigh and Atlanta in the first half of 2024. Vacancies in 30 of the top 50 markets declined in the first quarter as supply growth fell below still-strong absorption. Miami, Minneapolis, Inland Empire and San Jose led vacancy rate declines, each falling at least 50 basis points. As in 2024, Dallas led unit absorption in the first quarter, followed by Phoenix, which jumped up two spots in ranking. New York, Austin and Atlanta round out the top five.
— Lee & Associates Research Department. Lee & Associates is a content partner of REBusinessOnline. To read all of the 2025 Q1 North America Market Report, click here.
Industrial photo by Geoffrey Moffett on Unsplash.


