

Lee & Associates’ 2025 Q4 North America Market Report looks at diverging market demand across industrial, office, retail and multifamily spaces nationwide in the last quarter. Demand continued to soften for industrial spaces, while multifamily saw a reversal: decreased demand after seven consecutive quarters of strengthening. Office saw a slow increase in net absorption, but only after six years of negative absorption; retail demand was mixed.
Industrial and retail spaces contended with tariff concerns, while all four types of commercial real estate saw either decreased or slowed rent growth in the final quarter of 2025.
Lee & Associates’ full, detailed market report is available to read here. The overviews for the sectors below illustrate the market landscape through data on net absorption, leasing and development activity, sales transactions and rent growth, in addition to demand.
Industrial Overview: Demand Falls Under Tariff Pressure
Falling demand for industrial space continued in 2025 under the added strain of the United States’ aggressive trade and tariff policies affecting commercial property markets across North America. In the United States net absorption declined again in 2025 as tenant and rent growth fell to their lowest levels since the aftermath of the financial crisis. Meanwhile, inventory growth has been scaled back from a record development wave to pre- COVID levels.
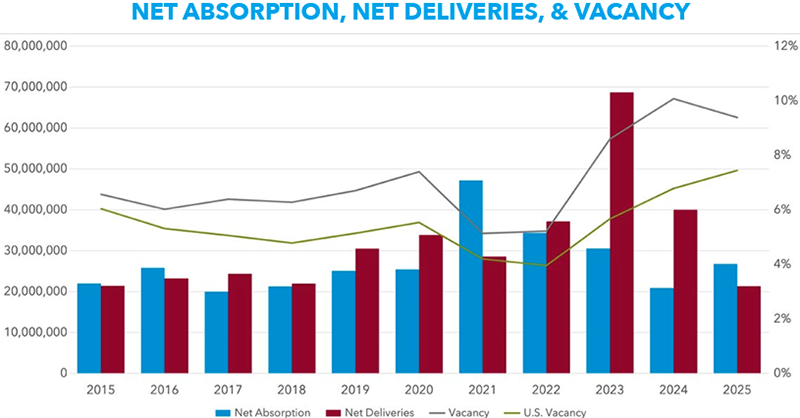
Net absorption in the United States totaled 112.5 million square feet in 2025. That was down 13 percent year over year and off 78 percent from the record 519 million square feet of tenant growth in 2021. In the last three years, U.S. net absorption has been trending downward, averaging 137.9 million square feet per year compared to a 388-million- square-foot annual average from 2020 to 2022.
Deliveries in 2025 totaled 253.6 million square feet, down 52 percent from the 526 million square feet record in 2023. For five years prior to the lockdown, completions averaged 211 million square feet. Deliveries averaged 381 million square feet since the 2020 lockdown compared to the 210-million- square-foot average for the five years prior to COVID.
Overall rent growth has decelerated from a record gain of more than 10 percent in 2022, to 6.3 percent in 2023, 3.2 percent in 2024 and 1.3 percent in 2025, the lowest since 2011 when the national vacancy rate was 9.6 percent following the 2008 recession.
The results were dispiriting for owners of warehouse-distribution buildings, which account for 68 percent of the 19.6-billion-square-foot market. Demand for logistics space was off 16 percent from 2024 and down nearly 81 percent from 2021’s record net absorption of 476.6 million square feet. The top 10 U.S. markets for net absorption in 2025 ranged from Dallas–Fort Worth at 26 million square feet, followed by Phoenix, Columbus, Ohio, Houston, Indianapolis, Kansas City, Washington, D.C., Chicago, Charlotte, down to Cincinnati’s 3.8 million square feet.
While deliveries have peaked, several Sunbelt and Midwest markets with fewer development constraints are seeing a surge in big-box completions that may take more than two years to absorb. Austin, Indianapolis, Greenville/Spartanburg, Phoenix and San Antonio are markets with risks of prolonged availability rates. The protectionist policies of the United States could potentially increase requirements for manufacturing space if companies onshore and reshore production.
But the uncertainty around tariffs has produced retailer inventory volatility, with many businesses reluctant to expand distribution networks without greater clarity. Fortunately, that clarity is expected from the Supreme Court this spring. The high court is poised to rule on whether President Trump can claim emergency powers to make trade agreements without Congress. The ruling against the government by the U.S. Court of International Trade was affirmed in August by a federal appellate court.
Office Overview: 2025 Sees United States Post First Annual Net Gains Since 2019
A strong second-half return of net absorption in the United States for premium office space combined with record-low new supply to produce positive overall net absorption — albeit less than 1 million square feet.
2025 brought a halt to the six-year, 215-million-square-foot slide that equaled about 2.6 percent of total inventory and came as companies leased up a net 17,741,120 square feet of Class A space in the second half. The improvement offset another dismal start to the year due to continued weakness in Class B space, which ended the year 10.6 million square feet in the red. As such, overall net absorption for the year totaled 960,163 square feet. The national vacancy rate declined a tick from an all-time high in the second quarter to close the year at 14.1 percent.
Despite the improvement, the demand picture remains complex. For example, performance among large metros was mixed. New York City posted 4 million square feet of net tenant expansion, driven by improved office attendance and steady leasing by financial services firms. Dallas–Fort Worth and Houston also outperformed with net gains of 2.1 million square feet and 1.9 million square feet, respectively, reflecting strong population and economic growth. San Francisco reported nearly 2.7 million square feet of net growth.
Several other major markets, however, are still searching for occupancy stability. Tenants in Washington, D.C., gave back over 3.5 million square feet in 2025, while Chicago reported more than a million square feet of negative absorption. Net occupancy losses totaled 2.1 million square feet in Los Angeles, 1.8 million square feet in Philadelphia, 1.6 million square feet in Boston and 1 million square feet in Atlanta.
About 40 million square feet were delivered nationally in 2025, the least since 2011. But with more than 30 million square feet erased from inventory through redevelopment, the net effect was an increase in the aggregate supply by more than 5 million square feet, a record low. One obstacle to a broad demand rebound has been stagnating office-using employment growth. Commerce Department payroll data show some 400,000 fewer workers employed in the major knowledge industries than at the April 2023 peak.
The hiring slump has been partially offset by increased attendance. One report showed Miami leading the nation at 84 percent of pre-pandemic attendance. New York at 77 percent and Dallas at 74 percent also were above the 64 percent national average.
Office sales transactions have been lagging since the pandemic in early 2020. Quarterly sales volumes fell to an average of $4 billion, about half of pre-COVID levels and well below other property types such as industrial and retail. There remains little appetite for office investment, especially with the uncertainty of the trade war weighing on job growth.
Retail Overview: Markets Largely Healthy; Demand Mixed
A recalibration by North American tenants occurred across several types of retail property in 2025 that stabilized many markets and preceded renewed momentum. Although demand for some property types is lagging, the markets are in overall good health.
Following weak demand in the first half of the year in the United States, which was beset with a spate of headline bankruptcies and store closures, there was a second-half rebound with the vacancy rate settling at 4.3 percent, just off the 2022 record. Nevertheless, net tenant demand declined for the fourth straight year since hitting 71.5 million square feet in 2021. Although availability remains near its highest level in nearly three years, it has leveled off at about 12 percent less than the previous 10-year average.
Net absorption fell from 20.5 million square feet in 2024 to 852,722 square feet in 2025 despite more than 12 million square feet of tenant growth in the fourth quarter. Merchant demand was dragged down by negative net absorption of nearly 8.8 million square feet in neighborhood and grocery-anchored space and a 2.6-million-square-foot contraction of power center space, the first annual loss since 2020.
Mall tenants shed 1.9 million square feet in 2025. It was the eighth straight year net absorption was in the red, putting some 36.6 million square feet back in inventory since 2018. And the inventory of mall space continues to shrink, losing 3.6 million square feet of space in 2025 and 12.9 million square feet, or nearly 1.5 percent since 2021.
Rising leasing activity reached its highest level in three years. The median time on market fell to a record low of about seven months, with premium locations generally leasing in less than five months. Smaller-format, freestanding and in-line spaces continue to dominate leasing activity.
On the supply side, elevated construction and financing costs, rising tariffs and higher terminal cap rates continue to weigh on new development. Most new supplies are limited to build-to-suits and pad sites, while speculative deliveries remain minimal. Overall development activity remains subdued, with projects under construction falling to their lowest since 2021.
Rent growth moderated in late 2025, with national asking rents rising at their slowest pace in several years. The deceleration reflects increased availability and more tempered retail sales growth, though rents remain supported by strong fundamentals. Adjusted retail sales per square foot are up 4.2 percent from 2024, and occupancy cost ratios are generally back to historical averages.
Meanwhile, property sales in the United States were up 31 percent compared to a year ago, reflecting a market in which buyers and sellers are more aligned on pricing and with capital flowing more freely.
Multifamily Overview: Demand Cools, Rent Growth Fizzles
Demand for apartments cooled across North America in the fourth quarter while rents in some areas receded amid continuing economic concerns. After getting hit occasionally with steep annual rent hikes, apartment dwellers across the United States have enjoyed a respite that appears likely to continue for another year or more, as a lingering supply-demand imbalance will keep near-term rent-growth flat and vacancy rates elevated.
Overall U.S. demand has been healthy until recently. But following seven straight quarters with net absorption topping 100,000 units, 2025 closed out with fourth quarter demand at 33,498 units, the least in three years. Year-over-year demand fell 19 percent. Meanwhile, there were 102,599 units delivered in the fourth quarter and 520,082 units completed for the year. The vacancy rate closed the year at 8.5 percent.
After hovering just above 1 percent year-over-year for two years, rent growth slowed to 0.3 percent in 2025. Twenty-three of the top 50 markets reported negative rent growth for the year.
Tenant demand was strongest in New York and large Southern and Southwestern markets such as Dallas and Atlanta. Robust net absorption earlier in the year was supported by steady economic growth, with national employment up roughly 1 percent year-over-year through midyear. However, signs of slowing economic and job growth began to emerge late in the year. As demand settles into a more typical pace, the development cycle is also set to wind down in 2026.
Austin posted the steepest decline, down more than 4 percent, followed by Denver, San Antonio and Phoenix at 3 percent. Rents fell by 2 percent to 3 percent in Tampa, Salt Lake City and Las Vegas. Concessions remain common in newly built properties seeking to stabilize occupancy. A value-weighted sale analysis shows multifamily prices bottomed in March 2024, down 27 percent from the 2022 all-time high. Losses have since moderated, with values now 21 percent below peak, still historically discounted but no longer falling.
Since early last year, Class A assets have consistently made up over half of all transaction volume for deals of 50 or more units. Cap rates for top-tier properties have generally stabilized in the low-to-mid 5 percent range, with pricing hovering just below $300,000 per unit. In contrast, cap rates in the Class B segment have crept higher, often straddling the 6 percent mark, while values have drifted down toward $175,000 per unit.
— Lee & Associates Research Department. Lee & Associates is a content partner of REBusinessOnline. To read all of the 2025 Q4 North America Market Report, click here.