

The headline numbers in commercial real estate rarely tell the full story. First-quarter 2026 data is a case in point: Lee & Associates reports that industrial and multifamily are slowly absorbing a historic supply surge, office is staging an uneven recovery, and retail is contending with a shortage of quality space rather than a glut of it. Here’s a sector-by-sector look at where U.S. commercial real estate stands heading into the rest of the year — and which markets are bucking the trend.
Sponsored: Download Lee & Associates’ 2026 Q1 North America Market report.
Industrial Overview: Logistics Demand Moderates; Small Space Needs Gain
There was continued weakness in the first quarter across North American industrial markets. The slowing has produced an overhang of newly delivered speculative logistics space, while rent growth has fallen to virtually nil.
In the United States, net absorption totaled 32.8 million square feet in Q1, or 0.2 percent of the 19.3-billion-square-foot inventory. It was the lowest rate of tenant growth in more than a decade aside from the 17.6-million-square-foot contraction in Q2 following the U.S.’s initial tariff announcements.
The overall vacancy rate in Q1 settled at 7.5 percent, which has nearly doubled since 2022 as new supply exceeds demand. There was an 8.4 percent Q1 vacancy rate among 13.6-billion square feet of logistics buildings, which account for 68 percent of the total industrial inventory in the U.S.
The U.S. industrial market has posted three years of weaker tenant demand. Net absorption last year was 122 million square feet, less than half the pre-pandemic annual average. Over the last 12 months leasing volume, excluding renewals, has risen above the prior two-year average in only about a third of markets surveyed. Markets with the strongest rise in leasing activity include Gettysburg, Pa.; Lancaster, Pa.; Ann Arbor, Mich.; Dover, Del.; Indianapolis; San Francisco; Worcester, Mass.; Raleigh, N.C.; Memphis, Tenn.; Miami; and Philadelphia.
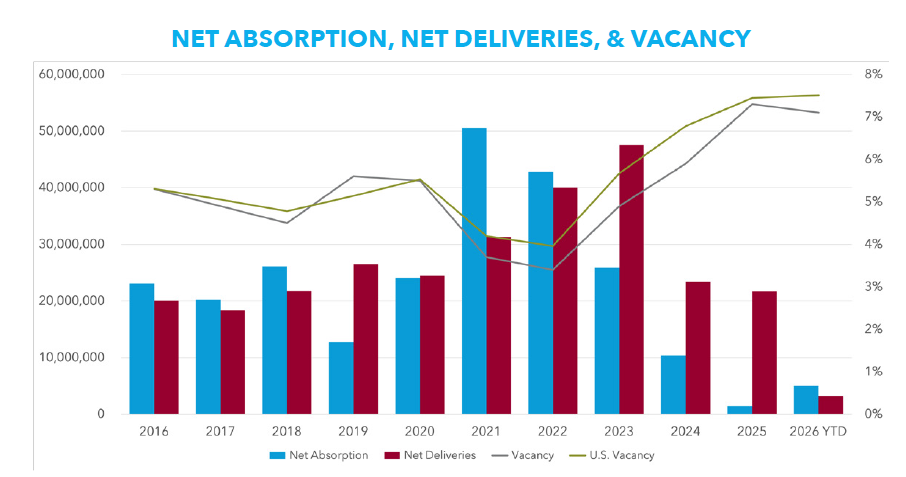
The U.S. industrial scene is nearing the end of a record development wave. While new deliveries have peaked, several Sun Belt and Midwest markets with fewer constraints on new development are amid a record supply surge that could take more than two years to absorb. Austin, Texas; Indianapolis; Greenville/Spartanburg, S.C.; Phoenix; and San Antonio stand out as markets with risks of prolonged higher availability rates with sizable inventories of big box logistics properties.
Due to stronger demand and chronically low availability of small spaces, the sub-5 percent vacancy rate in buildings up to 50,000 square feet is still near pre-pandemic levels. Spaces less than 50,000 square feet were listed for less than five months last year compared to 6.2 months for 50,000- to 100,000-square-foot spaces and more than eight months for spaces larger than 100,000 square feet. Some of the most acute shortages of small and multi-tenant buildings are found in Tampa, Fla.; Charlotte, N.C.; Nashville, Tenn.; Jacksonville, Fla.; and Orlando, Fla., fueled by demand from construction contractors and other businesses that serve local housing markets, such as HVAC installers and exterminators.
Office Overview: Modest Recovery; Uneven Geography
A tenuous office recovery was underway in the first quarter across large parts of North America, led by improved tenant demand for premium space. But the gains in the United States have been uneven geographically and possible because inventory growth virtually has been absent for more than a year.
There were 3,381,725 square feet of positive net absorption in the U.S. in the first quarter, which is weak by any historical measure. Nevertheless, it validated the surge in demand in the second half of last year when companies leased up a net 17,741,120 square feet of Class A space. The recent gains brought a halt to the six-year COVID slide that totaled 215 million square feet of negative net absorption, or 2.6 percent of inventory.
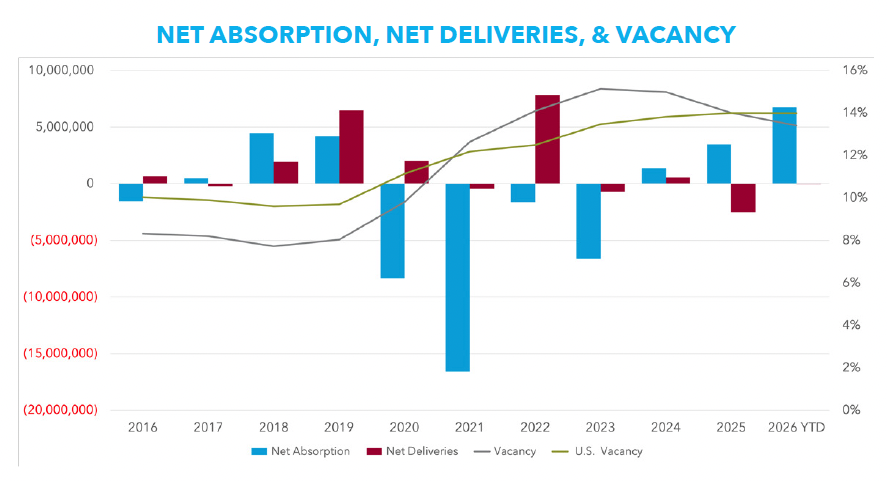
Performance across large cities in the last 12 months has been mixed, however. New York alone posted nearly 5.5 million square feet of net tenant expansion, driven by robust office attendance and steady leasing by financial services firms. Dallas and Houston also posted net growth of 2.5 million square feet and 1.8 million square feet, respectively, reflecting healthy population and economic growth. Notably, San Francisco saw more than 2 million square feet of positive absorption in the opening phase of what surely will be a long, slow recovery from unprecedented vacancy.
But many major markets still are searching for stability. In the last four quarters, Chicago net absorption losses exceeded 5.6 million square feet. Washington, D.C., was in the red 3.6 million square feet. Los Angeles was down 2 million square feet and Philadelphia lost 1.3 million square feet. Late-year gains in Atlanta, Boston and Philadelphia were not enough to bring full-year absorption into positive territory in those markets.
This degree of divergent performance is unusual in the national office market. Typically, at least 75 percent of major cities trend in the same direction.
One obstacle to a broad demand rebound has been stagnation in office-using job growth. The February payrolls report from the Bureau of Labor Statistics revealed that there are approximately 700,000 fewer workers in the major knowledge industries than there were at the peak in April 2023. Looking ahead, the picture is only somewhat brighter. Oxford Economics projects job growth to accelerate somewhat into 2027 before settling between 0.2-0.3 percent for the remainder of the decade, far lower than its long-run historical average.
Retail Overview: Healthy Demand Except For Malls
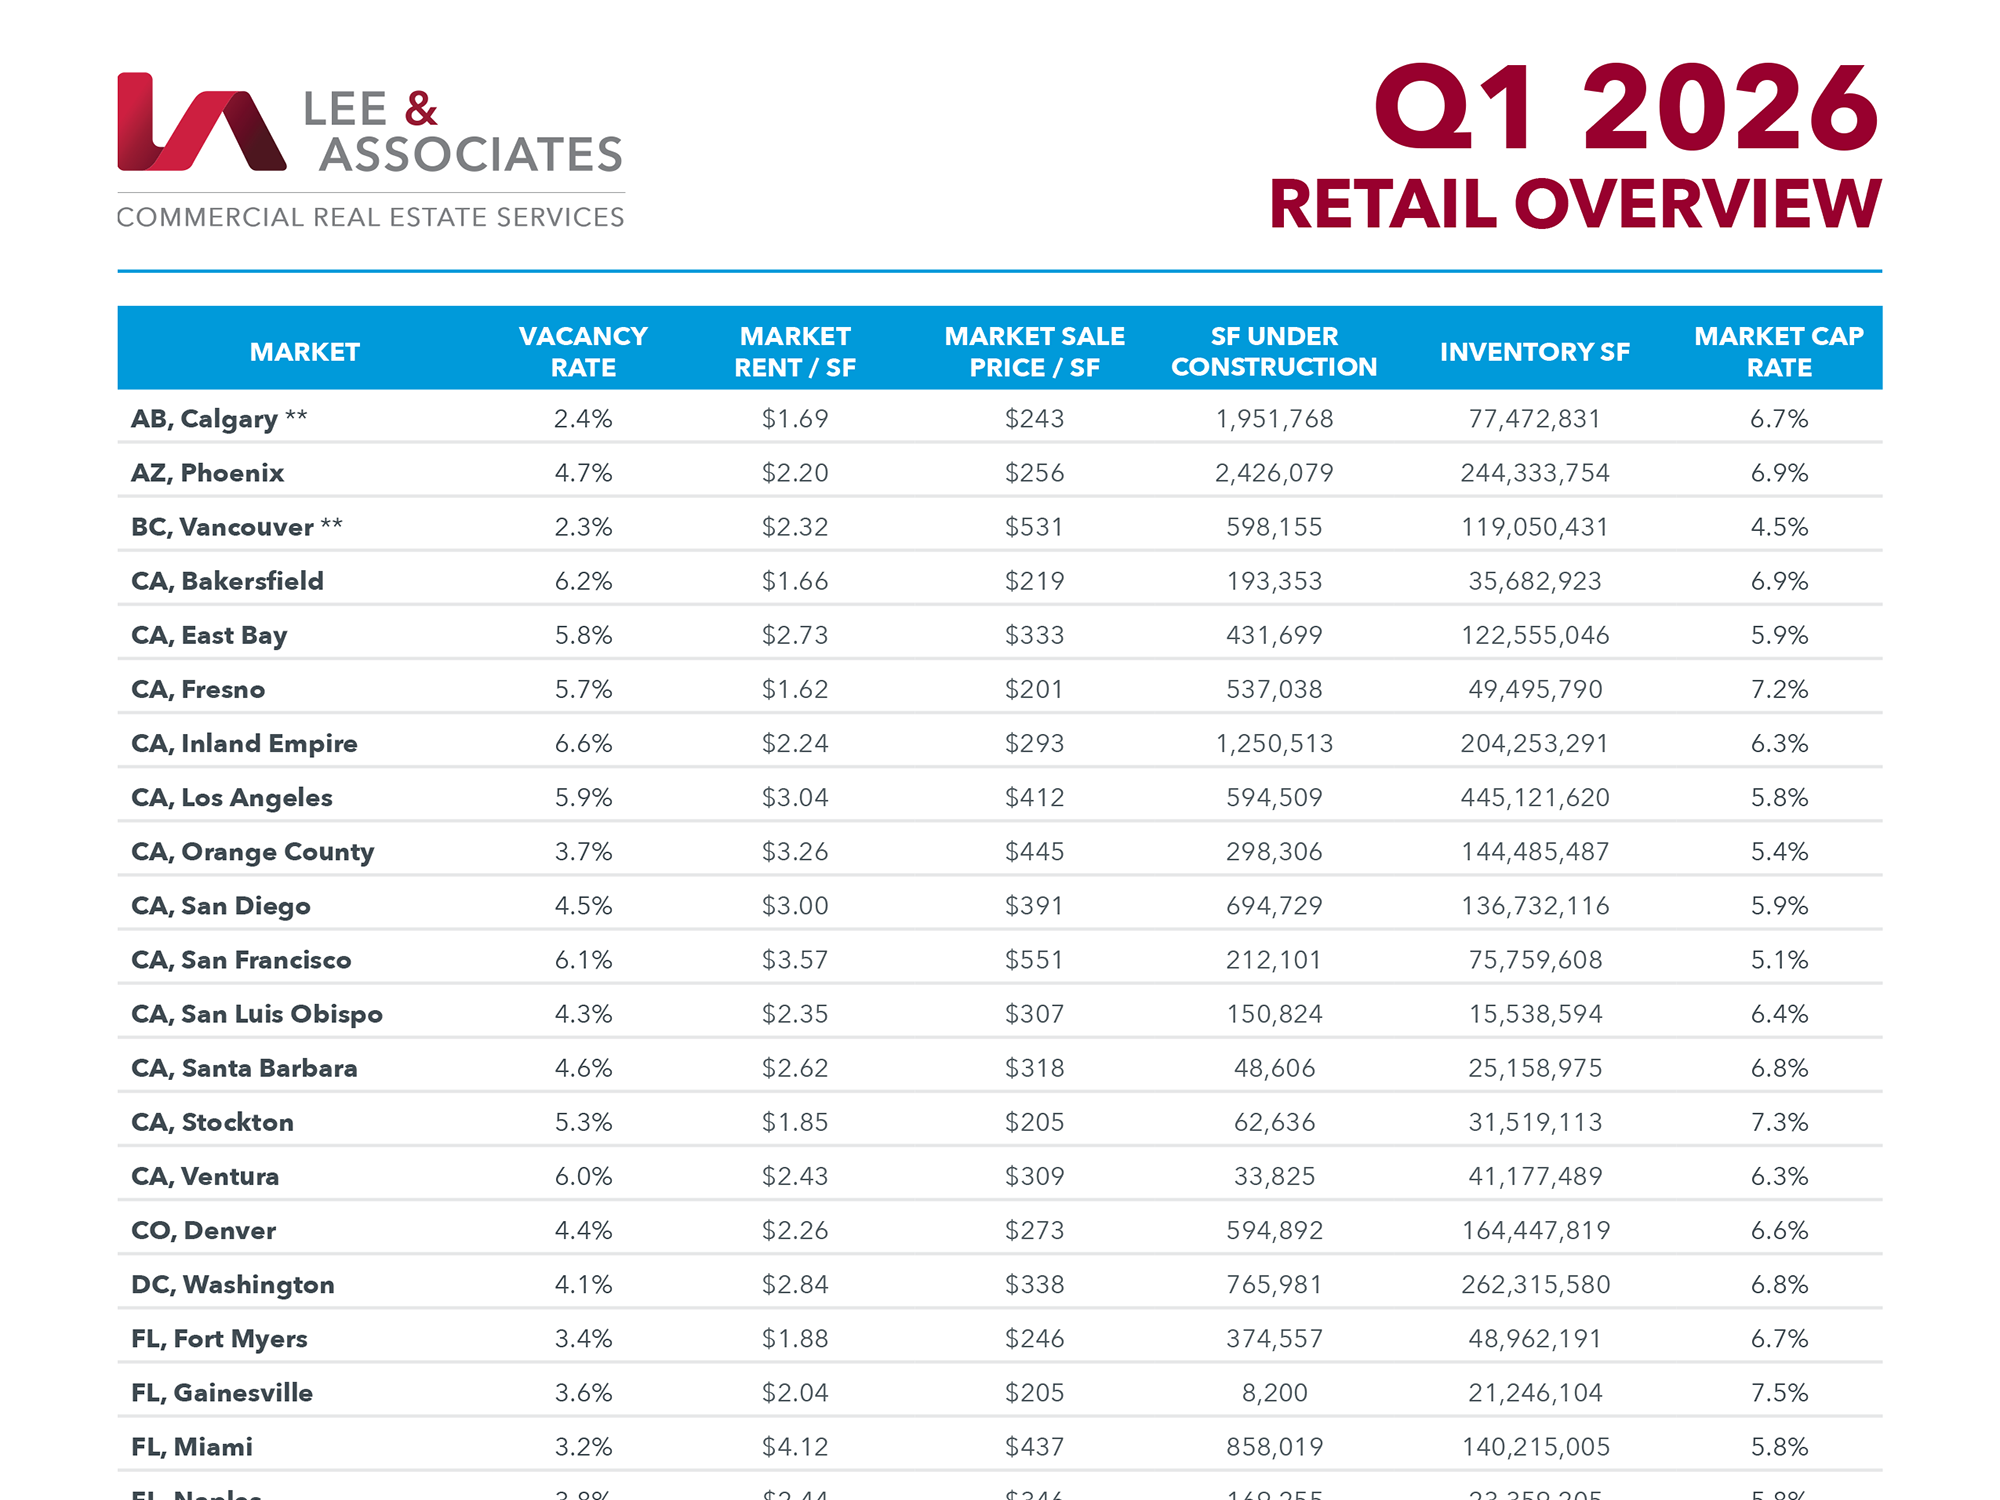
North American retail space overall is tight. In the United States, vacancy rates range from 2.7 percent for general retail to 9 percent among malls. The retail property category — particularly neighborhood centers, strip centers and single-tenant buildings — has performed well for investors overall in the last decade and particularly since the pandemic. Rent growth has been healthy but lost steam recently amid growing economic concerns.
While other product types have seen steady demand, mall space in the United States remains out of favor. Tenants in North America have given up about 32.6 million square feet of space since 2018. Approximately 7.2 million square feet of mall space was shuttered in the last five quarters.
The U.S. retail sector generally has been facing a pronounced shortage of quality space. Construction activity remains near its lowest level in more than a decade, and supply additions remain minimal due to elevated development and financing costs. More than two-thirds of all leases signed in late 2025 were for spaces smaller than 2,500 square feet. Nearly 90 percent were less than 5,000 square feet. This pattern reflects ongoing shifts in consumer behavior and tenant mix, with service-oriented and experience-driven categories such as fitness, food service, personal care and wellness accounting for a growing share of demand. Move-ins remained robust, with quarterly activity holding in the 90 million-square-foot range. Although space availability has risen modestly, particularly among larger anchor boxes, national availability remains well below its long-term average and near-decade lows for small-format space.
On the supply side, development remains historically constrained. Most U.S. markets have virtually nothing in the construction pipeline, and national under-construction volume sits near multi-cycle lows due to elevated construction costs, financing challenges and persistently higher terminal cap rates.
Transaction activity has returned to normal with buyers and sellers more aligned on pricing. Capital flows have been freer as bid-ask spreads narrow. High-quality assets in the single-tenant net-lease segment continue to command tighter yields. Well-located quick-service restaurant deals in prime markets are trading at less than a 5 percent cap. Grocery-anchored neighborhood centers also show signs of price stability: Apollo sold a 67,800-square-foot Kroger-anchored center for $17.6 million at a 6.1 percent cap.
Multifamily Overview: Weak Tenant Growth Continues; Rent Growth Nil
North American tenant growth has been declining and the new year was greeted with more weak demand and little to no rent growth. First-quarter net absorption in the United States totaled 76,245 units, off 42 percent from the same period last year. That followed 55,000 units of growth in the fourth quarter, the least since 2022. In the last four years, the overall U.S. vacancy rate increased from 5.1 percent to 8.5 percent with new supply exceeding demand by 824,335 units, which is equal to nearly 4 percent of the 20,766,620-unit nationwide inventory.
Supply in the U.S. was pushed to a 40-year high in 2024, an expansion that was fueled by strong demand and low capital costs. Annual net deliveries peaked at more than 690,000 units in the fourth quarter. The inventory fell by 24 percent in 2025 to approximately 529,000 units and is expected to decline by more than 36 percent in 2026 to approximately 333,000 units, the lowest level since 2014.
Markets in the Midwest and Northeast are relatively balanced. There is weakness in many South and Southwest markets due to oversupply. Rents have fallen across the South and Mountain West, including Texas.
Among the 50 largest markets, vacancy is highest in Memphis, Tenn.; San Antonio; and Austin, Texas. Twenty-five of the leading 50 markets posted negative rent growth in 2025 and more than 75 percent slowed in Q4 compared to a year earlier. Austin posted the steepest declines, down 4.9 percent, followed by Denver; Phoenix; San Antonio; and Tampa, Fla., which fell 3 percent to 4 percent. Rents declined 2 percent to 3 percent in Las Vegas, Salt Lake City and Raleigh, N.C. Concessions remain common in newly built properties during initial lease-up.
San Francisco led the nation in rent growth during the fourth quarter at 6.4 percent. Midwest markets also performed well with Chicago posting 3.5 percent and St. Louis and Minneapolis both growing 2.6 percent. In the Northeast, New York and Pittsburgh grew 2.2 percent and 1.9 percent, respectively. Norfolk, Va., stood out in the South with growth of 3.6 percent.
The slowing in construction also is uneven. Several major Sun Belt markets already are seeing significant pullbacks. In 2025, deliveries declined 18 percent in Phoenix, while the 2026 forecast calls for an additional 40 percent decline, from 21,000 units to 13,000 units. In Austin, deliveries are projected to decline 47 percent, while Denver is expected to see supply cut by more than half.
Conversely, some large markets continue to post elevated or expanding construction pipelines. Eleven of the 50 largest markets posted year-over-year increases in deliveries in 2025. Los Angeles; Boston; Columbus, Ohio; and San Diego are among the markets with rising supply. Miami and Charlotte, N.C., lead nationally, with more than 8 percent of existing inventory under construction, the highest ratios in the country.
— Lee & Associates Research Department. Lee & Associates is a content partner of REBusinessOnline. To read all of the 2026 Q1 North America Market Report, click here.