

After three years of new construction outpacing tenant demand in many sectors and areas, commercial real estate posted a mostly encouraging report card in the third quarter of 2026. Lee & Associates’ 2026 Q3 North America Market Report shows industrial demand nearly doubled from the second quarter, while retail and multifamily extended their rebounds. Office, the sector that had been staging a comeback, slipped back into negative tenant demand territory.
Sponsored: Download Lee & Associates’ 2026 Q3 North America Market Report.
Industrial Overview: Tenant Growth Gains in United States
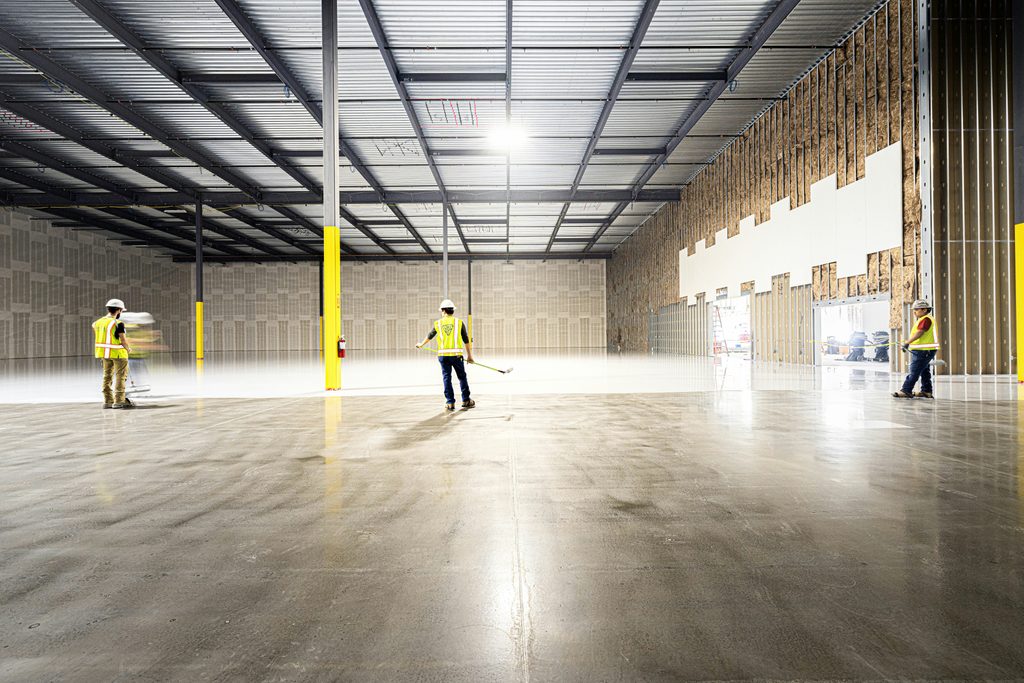
There has been broad general improvement across North American industrial markets, with demand for space rebounding in the United States. Third-quarter net absorption totaled 84,081,618 square feet, as more users gradually have set aside tariff and trade concerns that have hobbled tenant expansion since 2023. The third-quarter gains are an 89 percent improvement from 44.4 million square feet in the second quarter and a year-on-year jump of 172 percent.
The third quarter’s growth brought the year-to-date total to 161.2 million square feet as net absorption has recovered from three years of tepid growth. Despite the increase so far this year, tenant expansion continues to fall short of absorbing the volume of deliveries that total 168.5 million square feet this year.
Deliveries have totaled 1.3 billion square feet since 2022 against 576.2 million square feet of net absorption. The surfeit of space and weak demand has driven up the vacancy rate from 3.9 percent in 2022 to the current 7.3 percent.
The successive years of supply outpacing demand have shifted negotiating leverage more in tenants’ favor, and average national rents are no longer rising. Annual rent growth still measures 1.3 percent, but quarterly rent growth has gone flat.
Vacancy expansion has been concentrated in warehouse and distribution buildings comprising the logistics industrial subtype. Logistics building vacancy has expanded by over 400 basis points since mid-2022, reaching more than 8.2 percent today, a decade-plus high. In comparison, vacancies in manufacturing and other specialized buildings, as well as in flex buildings, have increased by only 150 and 270 basis points from their historical lows, respectively.
Still, tariff uncertainty, geopolitical risks and elevated operating cost pressures across the supply chain continue to weigh on most tenant expansion plans. Rising shipping costs tied to tightening trucking capacity, alongside higher fuel costs, are expected to pressure both shippers’ and manufacturers’ margins.

Office Overview: U.S. Tenant Growth Stalls
The post-pandemic recovery of the North American office market diverged in the third quarter as tenant growth stalled in the United States.
Nevertheless, the overall North American office market is posting its best year since the lockdown, with demand for U.S. space on track to halt its six-year slide totaling negative 223 million square feet.
After the U.S. market reported 29.7 million square feet of expansion across four straight quarters, third-quarter net absorption was negative 4.9 million square feet. Seventy percent of the third-quarter leasing deficit was in Class B buildings.
As a result, the U.S. vacancy rate has retreated about 20 basis points from its 14 percent peak reached in 2025. While vacancy remains historically high, the leasing market generally has recovered. The number of lease deals executed year to date was the most in a decade, but the average size remains roughly 15 percent less than in the late 2010s.
This has occurred despite a general lack of hiring by such traditional office-using employers as information, finance and professional services, which have shed some 600,000 jobs since early 2023.
The recent occupancy rebound is due to more stringent office attendance requirements by many major financial firms in New York, Boston, Dallas, Charlotte and elsewhere. AI-driven startups have produced a leasing surge in San Francisco and the Silicon Valley while helping sustain momentum in New York City. The resurgence is geographically mixed. Leasing volumes remain depressed in many other markets, including Atlanta, Chicago, Los Angeles, Seattle and Washington, DC.
Asset values have stabilized and some investors who forswore the category a few years ago have returned. Private investors have been buyers in nearly half the transactions. Institutional buyers executed roughly a quarter of the recent sales volume and users accounted for about 20 percent of trades.
Meanwhile, an unprecedented decline in new construction is shrinking the supply of desirable space. With 47.6 million square feet underway, the construction pipeline is near its lowest recorded level, lower even than the trough of early 2011. This has been a boon to competitive buildings that are seeing greater demand and real rent growth. On the flip side, vacancies are increasing in buildings nearing obsolescence; buildings at least 25 percent vacant collectively house 80 percent of all vacant space.
Retail Overview: Rebound Continues Amid Low Vacancies, Supply
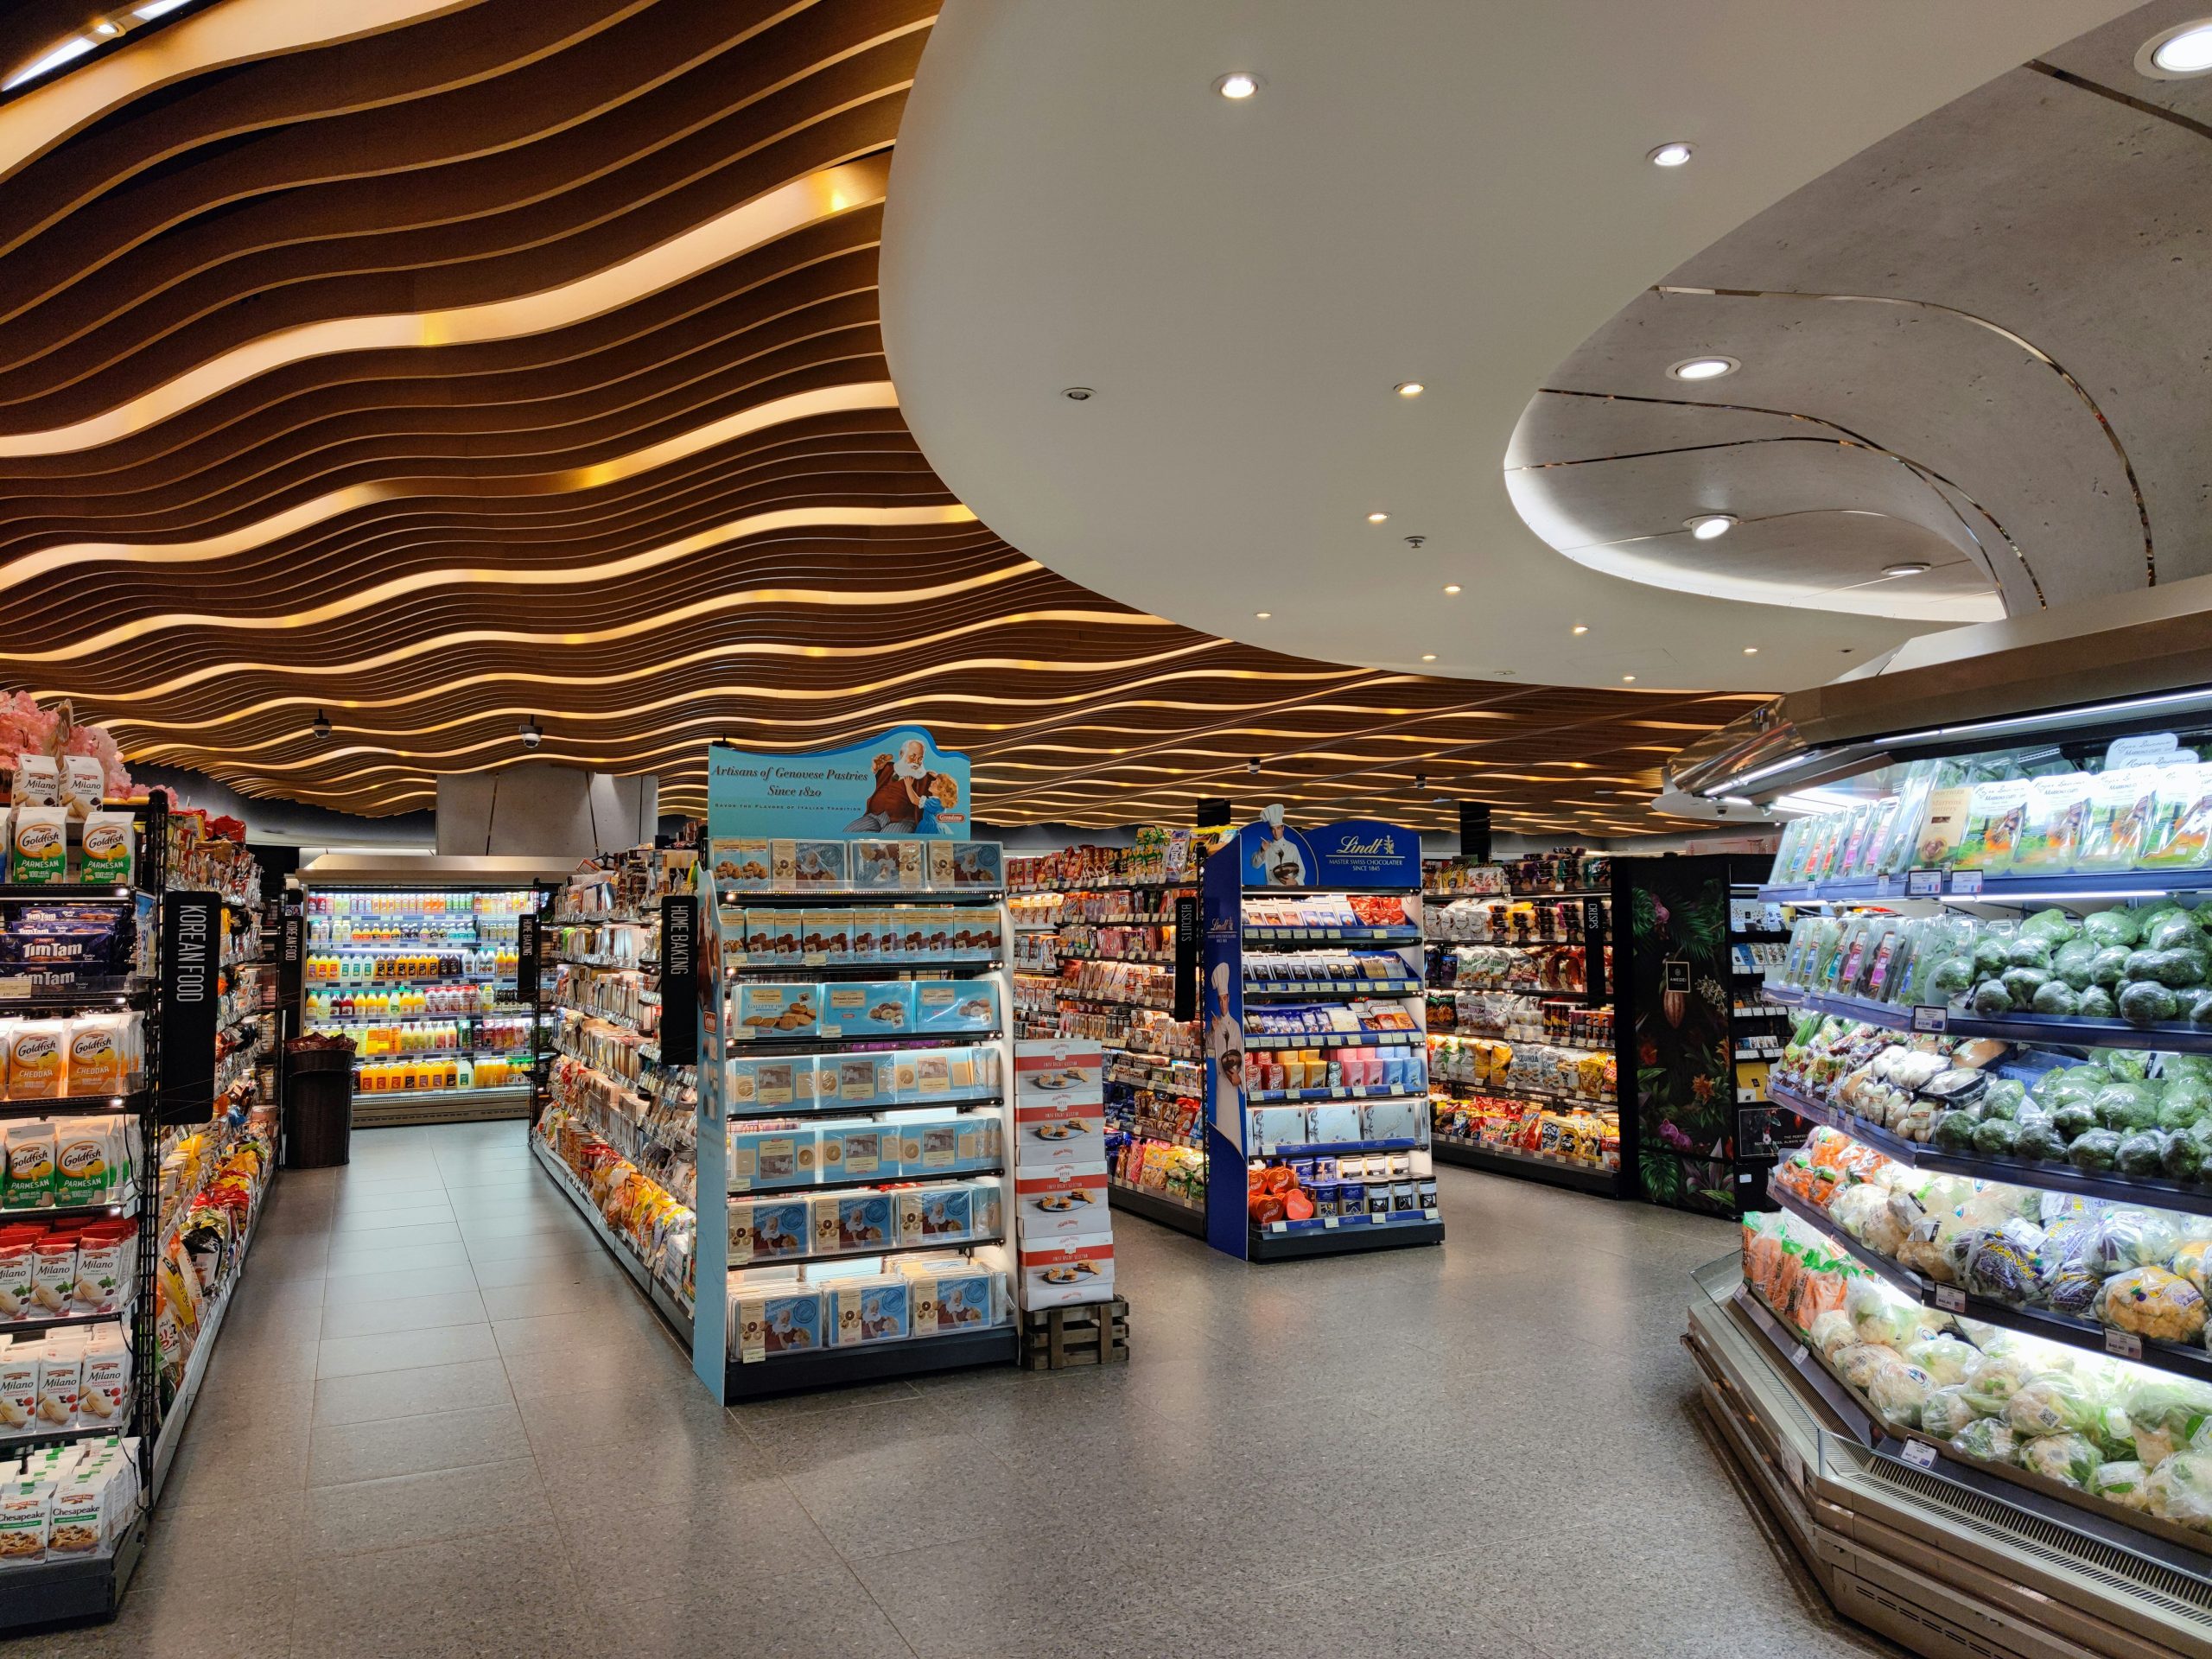
Demand for North American retail space continued to rebound with strong third-quarter merchant expansion in the United States. U.S. net absorption for the third quarter was 9,969,407 square feet, bringing the year-to-date total to 15,360,897 square feet — a turnaround from 2025 when overall tenant growth virtually was flat. The overall third-quarter vacancy rate settled at 4.3 percent and remains near historic lows. Available space remains scarce and retailer demand continues to exceed supply across many markets.
The recovery has been broad-based across formats, tenants and regions. The improvement was driven by a combination of stronger move-in activity, slowing closure-related move-outs and continued backfilling of space vacated during the prior 12 to 18 months. Retailers continued expanding in value-oriented, grocery, off-price, fitness, restaurant and service-oriented categories. The signing pace for future store openings remained elevated. And continues to outpace closures nationally, extending a years-long trend.
The most important force supporting fundamentals remains the sector’s limited supply. Construction starts remain near decade lows despite vacancy rates that would historically support a larger development cycle.
Leasing fundamentals remain exceptionally tight. Available retail space remains well below long-term averages despite several years of slower demand growth and intermittent increases in retailer closures. Increasingly, the primary obstacle to stronger absorption is not retailer willingness to expand but a shrinking inventory of quality availabilities. Elevated construction and financing costs, combined with a widening gap between achievable rents and replacement costs, continue to suppress speculative development for most markets.
Geographically, performance remains uneven. Several Sun Belt markets continue to generate strong rent gains, while a number of Midwest markets have begun reaccelerating after years of slower growth as excess availability has been absorbed. At the same time, supply-constrained coastal markets continue to benefit from limited development opportunities and persistent barriers to new construction. The Dallas-Fort Worth, Houston, Phoenix, Austin and several Florida metros account for a disproportionate share of the national pipeline.
The primary challenge remains project feasibility. Construction costs remain elevated, financing remains expensive and in-place rents remain insufficient to justify speculative development in large portions of the country. In many markets, developers would require rents well above prevailing market levels to support acceptable returns.
Multifamily Overview: Strong Tenant Demand
North American apartment demand improved in the third quarter. The United States market is on track for the largest annual gain in five years.
Net absorption in the United States totaled 195,454 units in the third quarter of 2026, a 9 percent gain over the second quarter, bringing the year-to-date total to 450,616 units. The market is reporting the most rent growth since 2022. The third-quarter vacancy rate fell to 7.8 percent, down 70 basis points this year.
The latest quarterly leasing activity exceeded U.S. historical norms despite slower employment growth and moderating demographic tailwinds. The strength of absorption shows durability while helping accelerate the process of working through excess inventory in many markets. With supply continuing to retreat from recent highs, 113,787 units were added in the third quarter, bringing the year-to-date total to 331,091.
Although accounting for 31 percent of the approximately 21-million-unit national inventory, the Class A segment accounted for 60 percent of third-quarter net absorption.
The South and Mountain regions continue to account for many of the nation’s highest-vacancy markets as they work through excess inventory, but conditions have begun improving in several previously oversupplied markets.
Thirteen of 16 markets with vacancy rates exceeding 10 percent recorded occupancy declines in the third quarter, highlighting improving conditions in many of the oversupplied markets. Charlotte, Phoenix and Jacksonville were among the markets posting meaningful improvements. Many Pacific, Northeast and Midwest markets remain comparatively well balanced.
Nationally, rent growth has improved from earlier lows and stands at 1.4 percent, compared with a low of 0.3 percent in the first quarter of 2026. While growth remains below long-term averages, reduced supply and improved leasing conditions have begun supporting firmer pricing across portions of the market.
Among the nation’s strongest-performing major markets in rent growth are San Francisco with 14.6 percent, San Jose 9.6 percent, East Bay 6.7 percent, Norfolk 5.7 percent and New York 3.8 percent. Pacific and Northeast markets continue to benefit from comparatively limited recent supply growth, while many Midwest markets have maintained balanced operating conditions despite a modest increase in development activity.
At the other end of the spectrum, seven of the nation’s 50 largest apartment markets continue to record negative annual rent growth. Thirteen have experienced slower rent growth than a year earlier. Rent declines remain concentrated in markets that received the largest volume of recent new supply, including San Antonio with -1.9 percent, Austin -1.4 percent, Denver -1.1 percent and Houston and Phoenix, both down 1 percent. Even so, conditions have improved considerably over the past year, when weakness was deeper and more widespread and as several markets recorded up to 4 percent annual rent declines.
— Lee & Associates Research Department. Lee & Associates is a content partner of REBusinessOnline. To read all of the 2026 Q3 North America Market Report, click here.
Retail photo by Cheung Yin on Unsplash.