
By Connor Watson, senior vice president, Partners Real Estate For years, the investment narrative around medical office as an asset class has been simple: stable demand, recession-resistant tenants and steady growth driven by the shift to outpatient care. That narrative is still true, but it’s incomplete. What’s shaping the next phase of healthcare real estate isn’t just demand. It’s a growing imbalance on the supply side. And in markets like Texas, that imbalance is becoming even more pronounced. Demand Isn’t the Story Anymore As a trend in healthcare real estate, outpatient migration is well understood at this point. Procedures continue to take place outside of traditional hospitals and within lower-cost settings like medical office buildings and ambulatory surgery centers. In Texas, that demand is amplified due to the following reasons: These economic and demographic trends have resulted in consistent tenant demand, high occupancy across most major markets and strong rates of retention from healthcare providers. But demand alone doesn’t create outsized opportunities; constraints do. The Real Shift: Supply Is Slowing Down New medical office development has quietly pulled back over the past several years. Not because demand isn’t there, but because the economics have changed. That shift is especially visible …
Market Reports
Conditions in Birmingham’s apartment market vary by submarket heading into 2026. Several recently completed developments downtown are still stabilizing, creating short-term leasing pressure, while suburban areas across the metro continue to see steady renter demand. Much of the new multifamily development in Birmingham over the past several years has been concentrated in the downtown core. As a result, many of these properties are still working through lease-ups. Marcus & Millichap research projects roughly 670 apartments will be delivered across the metro this year, with vacancy expected to hover around 6.1 percent and average effective rents near $1,302 per month. That level of supply has created temporary softness in parts of the downtown market. Some newly delivered communities are offering concessions during lease-up periods as owners compete for tenants. In certain cases, owners are choosing to refinance rather than bring assets to market while occupancy stabilizes. These conditions are typical when several projects deliver within the same submarket over a short period of time. Outside the city center, Birmingham’s suburban apartment submarkets continue to perform well. Cities including Homewood, Vestavia Hills and Hoover remain among the metro’s most stable suburbs. Shelby County cities, including Pelham and Alabaster, are also seeing consistent …
— By Rebecca Lloyd of Cushman & Wakefield — Salt Lake City’s industrial market ended 2025 in a transitional period defined by rising vacancy, shifting demand across product types, and heightened activity in both peripheral submarkets and the owner‑user segment. Overall vacancy climbed to 7.9 percent, driven by more than 8.5 million square feet of new warehouse/distribution deliveries since early 2024, nearly half of which remain available. This is particularly apparent in the North West submarket, which continues to dominate the region’s industrial footprint. Despite this supply influx, tenant demand held firm with 5.9 million square feet of new leasing activity recorded in 2025. Absorption remained steady across small and mid-sized facilities, with monthly net asking rents remaining stable at $0.80 to $0.81 per square foot. Smaller 10,000- to 100,00-square-foot buildings posted the tightest availability at 6 percent vacancy, while larger big box properties over 100,000 square feet saw vacancy rise to 15.7 percent, widening the performance gap between segments. Land scarcity, power constraints and elevated development costs continue to limit opportunities in core Salt Lake submarkets, forcing more tenants and developers to pivot toward Utah County. This is where a sizeable 4-million-square-foot proposed development pipeline is helping narrow …
By Jesse Tollison, Transwestern When analyzing the Minneapolis-St. Paul (MSP) metro area, urbanicity plays a deep role in understanding the opportunities for making a significant impact and profit in the commercial real estate markets. This is not a story unique to Minnesota’s largest metropolitan area, where roughly half of the state’s inhabitants live, but MSP serves as an illuminating case study as to how widely opportunity can vary between urban and suburban markets. Indeed, many areas across the country exhibit stark differences between their urban and suburban commercial real estate markets, but those differences cannot be uniformly applied to each metro. The qualitative and quantitative analysis of local minutiae lends tremendous insight when evaluating opportunities. Developers, investors, tenants, brokers and every other player in the commercial real estate world are paying close attention to the diverging urban and suburban trends as they assess the market for opportunities. In such a fragmented market, decision-makers are using more data than ever to inform their strategies. High-level views aren’t enough to benchmark a property’s performance, and it’s important to understand the localized trends when evaluating an opportunity. Industrial history As the historical industrial hub of Minnesota, the Twin Cities’ urban core has many …
By Taylor Williams The American office market remains awash in change as both tenants and landlords continue to grapple with now-familiar quandaries, from devising ideal hybrid work schedules to rightsizing inventory to putting forth the best mix of amenities, all while negotiating down to the last nickel of rent and last day of term. There are no right or wrong answers to these dilemmas outside of what works best for a particular company or building. Aside from flight to quality, there are very few common denominators across the spectrum of office usage from the tenant perspective. And aside from certain “must have” amenities and features, from the landlord perspective, there is no one-size-fits-all formula for wooing tenants back into buildings. For Texas cities with growing populations and well-located, obsolete office buildings, there are rarely obvious, cost-effective options for revitalizing or converting those structures. And above all else, there’s not a lot of clarity on the future of office utilization as a whole. So in the meantime, all that tenants and landlords — and their brokers — can do is try to make the smartest deal possible based on the information they have today. “In today’s market, every deal has …
The Birmingham industrial real estate market has remained relatively resilient compared to many U.S. markets, but recent trends show a shift in demand patterns with recent softness in the distribution sector compared to growing activity from manufacturing users. Overall market fundamentals remain stable. Birmingham continues to benefit from disciplined development and historically tight vacancies. Multi-tenant leased vacancy has generally remained well below national averages, hovering around the 5 percent range in the first half of 2025. Rent growth remains positive at about 3.5 percent annually. Renewing or vacant second-generation rents strategically lag new construction rents by about 15 to 20 percent. The second-generation base rent range is $6 to $7.50 per square foot depending on size, location and quality. Distribution and logistics demand has softened in recent months. Following the surge of warehouse construction and demand during the pandemic, leasing activity slowed by 2025. Approximately 1.3 million square feet of speculative space was delivered locally in 2022 and 2023, with asking rents at about $8 per square foot. The early deliveries benefited while the last projects to deliver were slower to lease as the economy stalled in the post-pandemic Biden era. Presently, 109,000 square feet of first-generation space delivered in …
— By Jared Glover of Berkadia — While several Sun Belt and Rocky Mountain markets continue to work through challenging operations, elevated supply and weakening fundamentals, Reno has emerged as a bright spot in the West. The city posted 2.5 percent year-over-year employment growth, adding more jobs in 2025 than Las Vegas. This is a remarkable stat given that Reno’s population is roughly one-fifth the size of its Southern neighbor. At the same time, Reno’s population grew at roughly four times the national average as median household income climbed to just over $90,000 as the economy continued to diversify into technology, healthcare and manufacturing. In fact, Northern Nevada saw 14 site visits per month last year for potential corporate relocations, according to a recent report by the Economic Development Authority of Western Nevada (EDAWN). This places the region it in the top 1 percent of U.S. markets, reinforcing long-term growth expectations. Several major development projects look to keep this momentum going. The most significant is the $1 billion transformation of the Reno-Tahoe International Airport, which saw a record 4.9 million passengers in 2025. The University of Nevada, Reno, also continues to invest heavily in new buildings to attract and retain top …
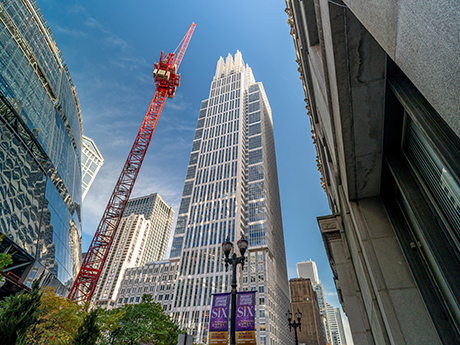
By Denes Juhasz, NAI Hiffman Two different star performers are emerging in Chicago’s suburban and downtown office markets. Practical Class B properties are gaining traction in the suburbs, while glitzy Class A+ trophy towers continue to outperform downtown. As the office sector adapts to post-pandemic workplace realities, the 278 million-square-foot metro Chicago office market ended 2025 with a 25.5 percent overall vacancy rate and 1.8 million square feet of negative net absorption. The suburban market closed 2025 with positive net absorption totaling 282,285 square feet, while overall vacancy held steady at 26.2 percent, largely consistent with the year-end 2024 level of 26.3 percent. Downtown, tenant space reductions and relocations continued to take a toll, with nearly 2.1 million square feet of negative net absorption recorded in 2025. Vacancy rose to 24.9 percent, up from 23.6 percent at year-end 2024. Well-performing assets and a reduction in inventory are helping stabilize the market, albeit unevenly. Three distinct trends are emerging: an outperformance of well-positioned Class B suburban properties, a continued flight to trophy assets in the central business district (CBD) and the conversion of obsolete buildings to alternative uses across the region. Rise of suburban Class B One of the most notable …
By Taylor Williams Nobody likes a vacant building, but symbolically, they do have some usefulness. A handful of empty structures here and there can be illustrative of a market that’s actually balanced and healthy, one in which tenants have some options and flexibility. In addition, vacant buildings can serve as warnings to future developers of what not to do and when not to do it. Attaching this allegorical significance to the New Jersey industrial market might seem odd, given that this sector has been and should continue to be one of the strongest segments in the country, in terms of both the geography and the asset class. The residential density, highly developed infrastructure and proximity to major ports and transit hubs will likely never lose their appeal to industrial investors and developers. But even the strongest markets can overheat from time to time, and it typically takes a couple years for the high to completely wear off such that indicators of market normalcy can become readily visible. That’s what appears to be taking shape throughout the Garden State’s industrial market. And without naming names or picking on specific projects, sources say that there are undoubtedly some buildings in New Jersey …
The Upstate South Carolina industrial market is at an inflection point — an expected condition in a maturing and evolving market. Similar transitions have occurred in prior cycles and have consistently required lease rates to adjust more rapidly than traditional annual market escalations. These adjustments are driven by a combination of factors, including supply and demand dynamics, construction costs, capital markets and broader economic conditions. Currently, construction costs are the primary constraint impacting new deliveries. The post-COVID development surge resulted in over 30 million square feet of speculative industrial construction, a portion of which has yet to be fully absorbed. Today, we are approaching pre-COVID metrics with roughly 6.4 million square feet of speculative inventory (delivered or under construction) and an overall vacancy rate of approximately 7.3 percent. At this level, certain submarkets are at the point where additional speculative inventory will be required to meet tenant demand. The challenge lies in pricing. Much of the existing vacant space was delivered under a materially different construction cost structure, resulting in lease comps that do not reflect today’s construction and land costs. While incremental rent growth has occurred, it has not fully bridged the gap between legacy pricing and the economics …