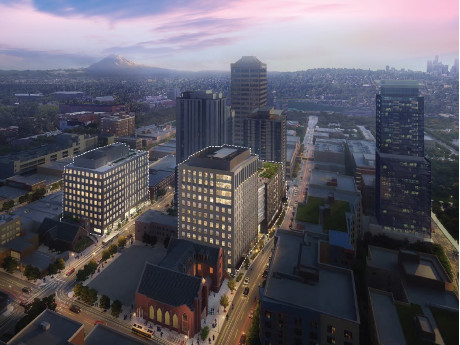
By Charlie Farra, Senior Managing Director, Newmark The Puget Sound office market has fared better than many peer metro areas during the pandemic. While the market remains tenuous in the region, local office fundamentals have improved to date in 2022. A consistent through the chaos is a flight to quality. If employers expect a return to office, they are being tasked with creating a physical environment that is far more favorable than a home office or local coffee shop. We are referring to this as “commute-worthy real estate.” Energy, collaboration, amenities, views, natural light and safety are some of the main points of focus and, due to current economic conditions, the ability to find such space at discounted pricing is within reason. New office leases are trending toward 75 percent of their pre-pandemic footprint as companies consider how and where to operate their businesses going forward. Professional service companies currently account for the most demand and are in the office more frequently than the technology sector. In tech cities like Seattle, this is a seismic shift from the previous decade, which saw skylines transform from the expansions of Amazon, Microsoft, Meta and Google. Many companies returning to the office are utilizing a hybrid …
Market Reports
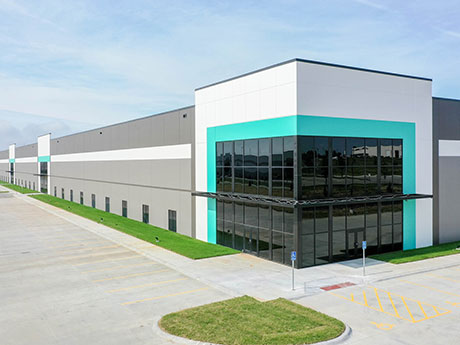
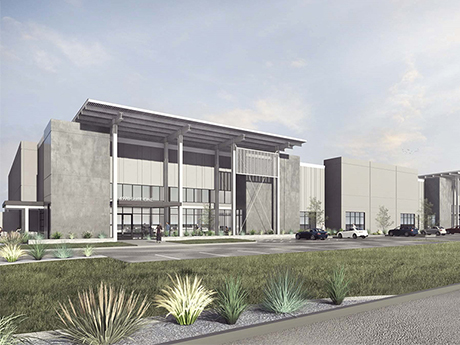
By Denny Sciscoe, The Lund Co. The Omaha industrial market is experiencing increased leasing velocity, positive rent growth and record-breaking development. The market consists of 18 submarkets, totaling 103 million square feet of inventory. Omaha has traditionally been a risk-averse market with steady, slow-paced growth. Since 2016, Omaha has seen increased speculative development, which is absorbed as fast as it is built. In 2020, we began to see hyper-development, fueled by increased demand and developer confidence. The increased demand was a result of COVID-19, where we experienced five years of growth in a 12-month period as occupiers scrambled to find space for inventories and e-commerce, which was exasperated by the demand to store “just in case” inventories. The supply and demand dynamics of our market have been almost perfectly balanced. The average deliveries are around 1.3 million square feet annually, and our average absorption has been around 1.4 million square feet. Since the beginning of 2022, we are tracking about 5 million square feet of demand and another 2.2 million square feet of space that is currently in the construction pipeline. Overall vacancy currently sits at 2.6 percent, which is 100 basis points below our average of 3.6 percent. …
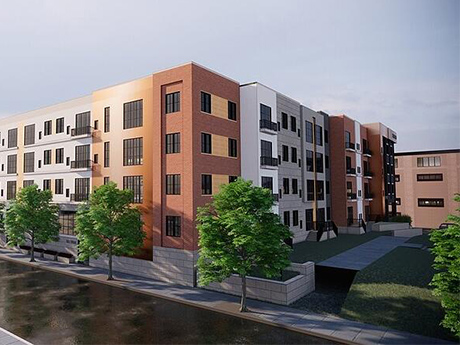
By Cody Roskelley, senior developer at Pennrose Texas has experienced tremendous residential growth over the last few years. Families are leaving high-cost, high-tax areas like New York and California for more affordable alternatives. According to The Tax Foundation, Texas was one of the Top 10 U.S. states for inbound migration in 2021, posting population growth around 1.3 percent on a year-over-year basis. With population increase also comes opportunities for economic growth and regional investment. However, having high-quality, affordable and workforce housing stock is key to the state successfully capitalizing on this moment. Between historically high rates of inflation and single-family home prices, as well as aggressive interest rate hikes, having the affordable housing infrastructure in place to attract new residents is critical. While most people generally agree that there is a need for more affordable housing, there is often local pushback once such communities are proposed in their neighborhoods. Much of the opposition stems from a lack of understanding of what affordable housing is — and isn’t. For example, individuals making anywhere between 30 to 80 percent of the area median income (AMI) can qualify for affordable housing. There are also several different subcategories of affordable housing: Low-Income Public Housing: …
Tenant Demand Remains High in Seattle Industrial Market, but Interest Rates Slow Investment Sales
by Jeff Shaw
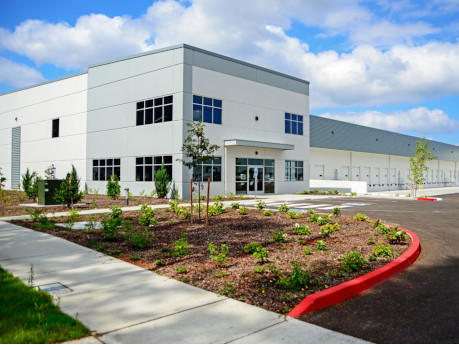
By Bill Condon, Executive Vice President, Colliers The most significant impact to Seattle’s industrial market this year comes from outside the market. Inflation resulting in raised interest rates has stymied sale activity but done little to slow leasing activity. Tenant demand has remained high, particularly among third-party logistics (3PL), ecommerce and aerospace companies. Logistics remains the main driver for activity and development in submarkets from Tacoma south. This year alone, Holman Distribution leased 353,000 square feet in Frederickson and Maersk leased 246,000 square feet in Lakewood. Both of these cities only had sporadic activity prior to 2020. For 3PL companies, the south Puget Sound/Tacoma area is attractive due to its proximity to the Port of Tacoma and the desirable labor pool in Pierce County. Closer to Seattle, Blue Origin leased 172,000 square feet in Kent, furthering the legacy of aerospace activity in Puget Sound. The rapid rise in interest rates has created a difference in expectations between sellers and buyers, whose interest rates have nearly doubled since the start of this year. This disconnect between the seller’s value and buyer’s ability to purchase is likely to delay transactions until there’s more stability in capital markets nationally. While tenant demand remains robust, there …
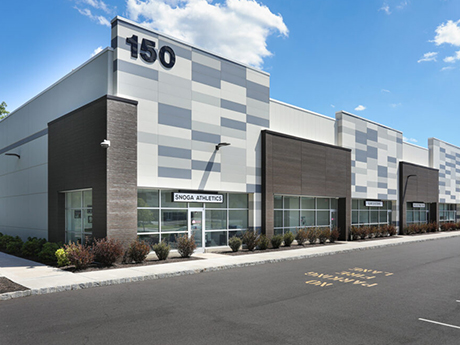
By Taylor Williams “Negative leverage.” At face value, the term has an undeniably ominous connotation. The first half is an umbrella word for all things adverse and pessimistic, while the second evokes a sense of financial helplessness and dependency, of being permanently hamstrung by creditors. Yet in the context of industrial investment in major markets throughout the Northeast, the term is more synonymous with flexibility and acceptance, as it represents a framework through which deals continue to get done despite the very dicey conditions of the U.S. capital markets. Since the Federal Reserve began aggressively raising the federal funds rates this spring to combat severe inflation, all commercial property types have been hit with softening buyer demand and, consequently, price declines. At the time of this writing, the nation’s central bank had a target range of 3 to 3.25 percent for short-term interest rates, nearly 300 basis points above its stated goal at the beginning of the year. Increases of that magnitude in the cost of debt adversely impact demand across all asset classes, as there are only so many buyers that can pay entirely in cash. Investors that can pay all cash expect — and usually receive — discounted …
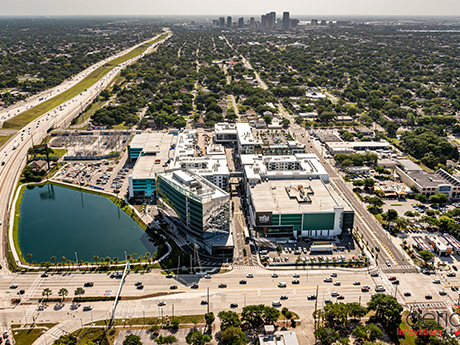
What was once a vacant landscape has undergone a modern-day renaissance, transforming into a thriving, energetic hub infused with dynamic retail, local chef-driven eateries and desirable living and working environments. Tampa has evolved into a top “a place to see” and “place to be” for both out-of-state guests and residents alike. What is one the main driving forces behind this urban revitalization? The rise of high-density mixed-use developments and lifestyle centers that create central spaces for people to live, work, play, shop, dine and explore new experiences. Recently, Florida has benefited from a massive influx of residents and development activity as a result of the COVID-19 pandemic. Varying demographics and age groups flocked to the Sunshine State in search of more space, agreeable weather and an expedient reopening as far as retail, restaurant and entertainment. Along with the mass of new residents, Tampa quickly rose to become the second most popular city in the country for prospective homebuyers, reflecting a new interest to settle down in the area. The retail sector also boomed state-wide, but specifically in Tampa, with retail rents growing 7.8 percent over the last 12 months and ranking among the top 10 fastest growing markets, according to …
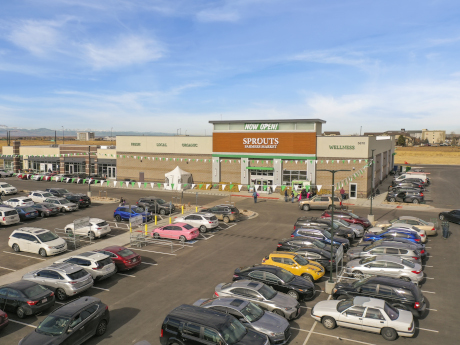
By Brandon Wright, Associate, Blue West Capital Retail properties in Colorado have experienced significant cap rate compression over the past five years and are selling for premiums compared to most markets across the country. Since 2019, the average cap rate for a single-tenant retail property in Colorado has compressed by 79 basis points, while cap rates for multi-tenant retail properties have compressed by 74 basis points. Cap rates this year for single- and multi-tenant retail properties in Colorado averaged 5.42 percent and 6.10 percent, respectively, through September 2022. Nationally, the average cap rate for these two property types were 5.62 percent and 6.53 percent. Cap rates in Colorado have remained compressed despite various headwinds facing the market. There’s a notable supply and demand imbalance of high-quality properties. The limited inventory of available properties and strong national demand for Colorado properties has helped keep cap rates near record lows. Public and private REITS, family offices, high-net-worth individuals and 1031 exchange investors remain optimistic on Colorado for its long-term upside and growth, and are looking to deploy capital here. Colorado has a vibrant and diverse economy, in addition to strong demographics that include a young and educated workforce. It is the fifth most educated state, …
By Traci Kapsalis, JLL It’s no secret that the COVID-19 pandemic turned every office market across the globe upside down. In the process, quality of life, health and well-being have become top priorities for office workers, as well as a push for hybrid and flexible working models. To understand and support these evolving expectations, local governments, employers and landlords are working together to identify and shape their new future of work. In fact, new research from JLL reports that the next three years will be a critical phase for commercial real estate strategy, representing a crucial window of opportunity that will determine how successful companies (and cities) will be in adapting to rapid changes. At the crossroads of America, the Indianapolis market is well on its way to a reimagined office environment. Here are three demonstrable signs. 1. Flight to quality dominates the office market Leasing activity for Class A office properties is strong in Indianapolis. According to a recent report, activity in this sector is reaching new heights as it achieved 248,000 square feet of occupancy growth in the second quarter — the highest in a single quarter in over four years — and hit record-high rents of almost …
By Taylor Williams Much as the commercial community and society at large would like to avoid a recession, prolonged periods of contraction are part of the natural economic cycle, and the U.S. financial powers that be appear to be on a collision course for exactly that scenario. But for assets classes backed by exceptional demand drivers and fundamentals, like industrial real estate in major Texas markets, is there really a need to sweat a downturn? Like any conflict, the battle between macro- and micro-level forces essentially comes down to magnitude. Will the severity of interest rate increases — three separate hikes totaling 200-plus basis points in a few months — prevail over robust tenant demand that has fueled record occupancy and rent growth throughout Texas and beyond in recent years? Only the Federal Reserve can speak to the first variable. The nation’s central bank appears hell-bent on whipping inflation, which registered a year-over-year increase of 8.3 percent in August, and is seemingly resigned to the inevitability of recession as a byproduct of its monetary policy. As for the competing forces that are industrial fundamentals, third-quarter figures were not available at the time of this writing. But, using Dallas-Fort Worth (DFW) …
Following the trends of both regional and national multifamily statistics, the Louisville metro area has had a robust stretch of development, repositioning and innovation in the multifamily housing sector that has surpassed 10 years in duration. With a population of 1.32 million, there are 516,000 households in Louisville with an average household income of $69,000. Pursuant to a recent CoStar Group report, Louisville has a total inventory of just over 84,000 units. It is anticipated that there will be over 91,000 units by 2026, a 8.3 percent increase. CoStar also forecasts that the Derby City’s vacancy rate will hover around 5.5 percent in 2026. One of the projects under development includes The Reserve (the Stable) at English Station. The 172-unit, Class A community adjoins a patio home development that was developed by Sunshine Industries. The property is slated for completion in January 2023. As far as popular neighborhoods for development, there are several recently developed or under construction projects in the city’s East End district. The city’s economy has benefited from the accelerated adoption of e-commerce as a result of the pandemic. Retailers and logistics providers are leasing a record amount of space as they seek to expand their distribution …


