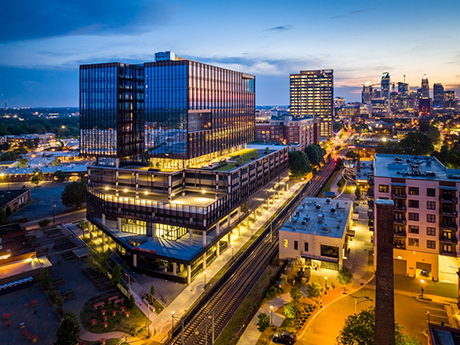
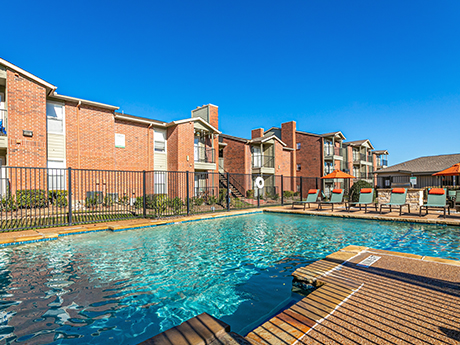
As Charlotte continues to expand its economy and population, its multifamily market is reporting unprecedented levels of activity. The market has experienced a tremendous rebound from the artificial pandemic performance in terms of investor demand, in-migration and rent growth. The market recorded double-digit rent growth in 2021, extremely tight vacancies across submarkets, record lease-up velocity and a modest supply of new deliveries. All these signs clearly point to a landlord’s market, and investors have taken notice. This year looks to be another solid one for Charlotte’s multifamily investment market, coming off a record-setting 2021 with nearly $6.4 billion in transactions (compared to $3.5 billion in 2020 and $3.7 billion in 2019). So far in 2022, pricing remains strong and sales are ahead of the pace set at the start of last year ($1 billion in first-quarter 2022 vs. $566 million in first-quarter 2021). Companies and residents are flocking to Charlotte, which is increasingly recognized as a high-growth market. It is business-friendly, offers a great lifestyle and is a talent magnet. Lowes, USAA and Centene are examples of companies expanding their footprints and hiring thousands of employees, all who need a place to live. Moreover, these are high-paying jobs ($100,000-plus), targeting …
Market Reports
By Joe Aquino, president, JAACRES When Barneys New York department store closed in 2020, we saw a dramatic relocation of luxury retail on Madison Avenue to the south, apparently with a common goal of establishing better proximity to East 57th Street. Prior to that event, many luxury brands enjoyed a shop within a shop at Barneys, plus another store on the corridor, usually further uptown. Prior to the COVID-19 pandemic, this stretch of Madison Avenue was so tight for space that we saw East 59th Street, a major side street, securing tenants like Dior, Bathing Ape and Balmain. During the pandemic’s lockdown phases, retail vacancy rose dramatically, even in the most desirable areas. Now, post-pandemic, we see spaces along Madison Avenue getting filled by new and established luxury retailers ready to make a statement. Here are some of the key transactions that have either been recently completed or are in progress: Givenchy just left its cozy quarters at 749 Madison Ave. at the southeast corner of 65th Street to take the southeast corner at 625 Madison Ave. Versace will open in Givenchy’s place this fall. Wolford, a maker of luxury seamless tights, took the Lalique store at 607 Madison Ave. …
By Chris Curran and Alexa Strickler, R&R Realty Group It’s no secret that the past couple of years have been dramatically different for us all. We’ve had to adjust to new routines, new practices and new ways of getting work done. Some of these new things will be here to stay while others have already receded into memory. No matter the amount of change though, one thing remains the same. That’s the need for human connections and relationships. And, ultimately, that’s what physical office space provides. It seems many organizations are starting to understand just how valuable this connection truly is. Across various submarkets within the Des Moines metro area, companies large and small are returning to in-person work. And it’s not just existing customers returning to their spaces. There has been a marked uptick in office leasing activity in locations ranging from downtown to the western suburbs. From advertising agencies to accounting firms and more, the vacancy rate across the entirety of central Iowa is beginning to be chipped away. Why are so many companies across a wide variety of industries heading back to the office? Well, like we mentioned earlier, there’s a sense of connection and an ability …
By Ryan Sarbinoff, First Vice President and Regional Manager, Marcus & Millichap A growing, educated local labor force and lower rents compared to other office hubs in the region are driving office tenants to Las Vegas. The metro registered the largest drop in office vacancy among major U.S. markets over the 12-month span that ended in March, as tenants absorbed more than 2 million square feet. Much of this space was at Class B/C properties, with the subsector noting the strongest four-quarter span for demand on record. The resulting 330-basis-point reduction in overall availability during the year-long period slashed vacancy to a more than 15-year low of 12.4 percent, enhancing the sector’s outlook heading into the second quarter. The metro’s second-largest submarket by inventory, Southwest Las Vegas, exemplifies the strength of the local office sector. During the past year, the area accounted for half of the metro’s 20,000-square-foot-plus lease executions. International Gaming Technology’s sublease of a three-story building highlighted recent activity, with VisCap Media, Agilysys, DraftKings, Kiewit and Molina Healthcare all making notable commitments that dropped vacancy to 9.4 percent in March. Apart from leasing, this submarket is also the center of development. Roughly 60 percent of the space slated for completion …
By Marshall Mays, vice president, Colliers Dallas-Fort Worth (DFW) is a hot market for commercial real estate right now, with people from across the country relocating to the area every day. The metroplex’s population is growing at an annual rate that rivals those of other top U.S. markets, including Austin, its neighbor to the south that is often considered to be a more glamorous city. With the increasing number of businesses relocating to Texas and more offices opening back up, the urban core of Fort Worth has become a particularly popular destination for industry growth in Texas. The Market Today The performance of Fort Worth’s office market has been particularly encouraging since the start of 2021. Overall, the city’s office vacancy rate currently stands at 13.3 percent, down from a pandemic-era high of 14 percent in the third quarter of 2020. This positive trend is aided by a quicker “return to office” in DFW. According to research from Kastle Systems, a security company that provides access control systems for office buildings around the globe, Texas as a whole has outpaced major cities and other states in terms of the speed and degree to which office occupancy rates have been recouped. …
By Chase Monroe, Carolinas Market Director and Charlotte Brokerage Lead, and Chris Schaaf, Executive Managing Director of Tenant Representation, JLL Nearly two years after the onset of the pandemic, Charlotte’s office market is showing strong signs of recovery as economic momentum builds. Last year, the Queen City set the stage for growth with 4.9 million square feet of office space delivered from pre-pandemic projects, boasting over 1 million square feet more than any other metro for deliveries that occurred in 2021. Market-wide preleasing also exceeded 60 percent and nearly 2.1 million square feet of office space was under construction. Entering 2022, the market continued to forge ahead as large occupiers started their return to the office, and leasing activity began to surge throughout the region. And long-anticipated projects, such as Legacy Union, 110 East and The Station broke ground. According to Urban Land Institute’s 2021 annual report, Charlotte ranked No. 6 among the hottest real estate markets in the United States, with developers and investors betting big on Sun Belt cities. Deemed an 18-hour magnet city by the Emerging Trends in Real Estate survey, people and businesses alike are flocking to Charlotte, the so-called “migration destination.” Thanks to strong economic …
By Al Silva, senior managing director, investments, Marcus & Millichap; and Ford Braly, first vice president, investments, Marcus & Millichap The multifamily segment in Fort Worth is in a great position. The metro’s vacancy rate slid down to a multi-decade low of 3.1 percent last year, which facilitated stellar rent growth as the number of available rental units plummeted. Fort Worth’s average effective rent grew more than 15 percent in 2021 to $1,276 per month, and the elevation in 2022 is expected to remain in the double digits. Behind this momentum is robust household formation as citizens relocate to the metro for greater job availability, cost-of-living considerations and quality of life. An average of 16,300 new households were created annually in the Fort Worth metro area over the past decade, and the 2022 addition is expected to eclipse that benchmark by about 20 percent. This rate of household creation is about twice as fast as the national pace and is happening at a time in which the barriers to homeownership have rapidly intensified, pushing much of the new demand toward the rental segment. Barriers to Homeownership The median price of a single-family house in the Fort Worth area climbed to …
By Ryan Kelly, TWG Development Despite the affordable housing crisis, Des Moines has managed to endure the adverse factors that have caused a boom in housing prices nationwide — but we still have a ways to go. A sustained demand, an influx of business and new projects by national developers all played a role in Des Moines’ multifamily growth over the past two years. Developing Des Moines Home to some of the largest multinational finance and insurance corporations, Des Moines has pioneered Iowa’s growth. The city has also seen population growth — the most recent census revealed that Des Moines’ suburbs led to Iowa’s development while the city itself grew by 5.4 percent. Des Moines is the 10th-best place for business and careers, according to Forbes, and ranked as the fifth-best city to live in, according to U.S. News and World Report. The capital city has experienced a boom in employment, with a rise in the number of high-tech jobs, at a 6.7 percent rate. The Midwest’s low cost of living (7 percent lower than the national average) and Des Moines’ proximity to large cities have contributed to the growth of key industries, including logistics, ag-bioscience, manufacturing, data and insurance. …
By Nellie Day All of Los Angeles County might have been under the same restrictions throughout the pandemic, but their emergence from this period reveals a lot about the localized retail environments. “Los Angeles’ retail market has weathered COVID better than many other markets around the country,” says Matthew May, founder of May Realty Advisors in the Los Angeles submarket of Sherman Oaks, Calif. “However, the recovery has favored a diverse group of suburban markets.” Certain Suburbs Stand Out Markets like East Hollywood/Silver Lake, Inglewood/South LA and Santa Clarita boasted the highest 12-month rolling net absorptions in the county, according to CoStar — something May doesn’t believe was expected. “LA is known as a melting pot and this is reflected in the geographic and ethnic makeup of the top submarkets based on net absorption,” he says. “Vacancies in many of the suburbs were substantially less than in the Central Business Districts and tony retail areas from Beverly Hills to Abbott Kinney. These emerging markets were quite a surprise.” On the other hand, metro markets like Santa Monica, Downtown LA and Koreatown each had more than 100,000 square feet of negative absorption. Santa Monica’s Third Street Promenade has been one of …
There is no denying in-migration is a driving factor in South Florida. Over 650,000 people moved to Miami at the height of the pandemic — nearly 89,000 came from out of state and a quarter of those came from New York. Year-over-year job growth is up 6 percent and is back at peak levels seen prior to the pandemic, while over 27 percent of employment is in office-using sectors for the first time ever. CBRE’s Spring 2022 Occupier Sentiment Survey revealed that most companies are back to developing long-term plans to expand or contract their office space now that employees are returning — at least some of the time — after two years of mostly remote work. For the second quarter in a row, net absorption in Miami totaled over 200,000 square feet, with the majority occurring in Miami’s central business district (CBD). Driven by expansions, Class A product accounted for approximately 85 percent of total absorption in the first quarter. The growth of Miami is starting to solidify as new-to-market tenants that looked to relocate to Miami during the pandemic are starting to move into their office spaces. Since 2020, over 1.3 million square feet of office leasing activity …


