High costs, modulating occupancies and a lack of financing options reshaped the industrial, office, retail and multifamily sectors in the fourth quarter of 2023, signaling the determining factors for 2024, according to Lee & Associates’ 2023 Q4 North America Market Report.
The industrial sector saw stabilizing tenant demand — the number of new buildings delivered increased in the fourth quarter, while new construction starts slowed.
Meanwhile, the office sector’s struggles deepened as more than half of the office leases signed pre-2020 approach their expiration by 2026. With low-rate loans maturing into a high-rate environment, the factors troubling the office sector seem insurmountable in this decade.
In the retail market, low vacancies did not lead to booming construction in that sector in the last quarter of 2023 — financing costs plus land and labor costs have hampered new development in spite of high demand.
Finally, the health of multifamily markets is tied closely to geography. Sun Belt multifamily properties and their Midwest and Northeastern market counterparts are seeing reversals from the multifamily trends of 2021: formerly fast-growing Sun Belt markets are experiencing slowed rent growth or rent decline, while rent growth for slower-growing, major North and Midwestern metros has grown steadily.
Lee & Associates has made their full market report available here (illustrating breakdowns of 2023’s cap rates by city, vacancy rates, market rents, inventory square footage and more). The summaries from each sector below provide in-depth considerations of the overall outlook and the difficulties the market can expect in 2024.
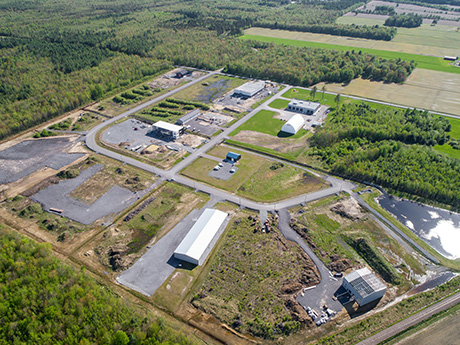
Industrial Overview: Rent Growth Remains Strong Despite Sputtering Demand
Demand for industrial space in North America sputtered in 2023, hobbled by a host of post-pandemic economic and supply-chain issues. Among these issues were declining imports, retailers caught with surplus inventories and slumping receipts for furniture, appliances and building materials from a 12-year low in home sales. Additionally, there were wide expectations for an economic recession.
Net absorption totaled 164.8 million square feet in the United States in 2023, a 61 percent drop from the 422.7 million square feet of tenant growth in 2022 and a 69 percent decline from the record 524.7 million square feet in 2021. It was 32 percent less than the 242-million-square-foot average of the five years prior to the pandemic.
In the United States, there are recent signs of stabilizing tenant demand as a record 528.7 million square feet were delivered in 2023. The increasing supply is expected to push up the vacancy rate through the first half of 2024, but construction starts have fallen to a 10-year low. Across the 87 markets in the Lee & Associates survey, there are 451 million square feet of projects under construction and most remain unleased. New product has driven up the U.S. industrial vacancy rate from a record low of 3.9 percent in mid-2022 to 5.9 percent at the end of 2023. That is still comfortably below the market’s 20-year average vacancy rate of 7.3 percent. The stock of industrial properties in the United States is set to grow by more than 3 percent in 2023, the fastest pace of growth in more than 30 years.
The recent slowdown in demand has been broad-based, but Los Angeles, the Inland Empire and Seattle recorded outsized increases in space available for lease. While U.S. imports have been declining since November 2022, the slowdown has been most pronounced at major West Coast ports. But after year-long contract talks, dockworkers recently agreed to a six-year deal that should help stabilize tenant demand.
In the majority of major coastal markets including Los Angeles, South Florida, Richmond, Northern New Jersey and Lehigh Valley, the current pipeline of projects underway is barely large enough to meaningfully ease the distribution space shortages that developed during the pandemic. Markets including Tampa, Jacksonville, Milwaukee and Detroit have bucked the national trend and recorded tightening availability rates through most of 2023.
Jacksonville and Tampa have been direct beneficiaries of rapid in-migration and the continued diversion of Asian imports through the Panama Canal to East Coast and Gulf Coast ports. Milwaukee and Detroit also have benefitted from limited or fast-declining levels of speculative construction, coupled with continued expansions by manufacturing tenants and distributors.

Photo by Nastuh Abootalebi on Unsplash.
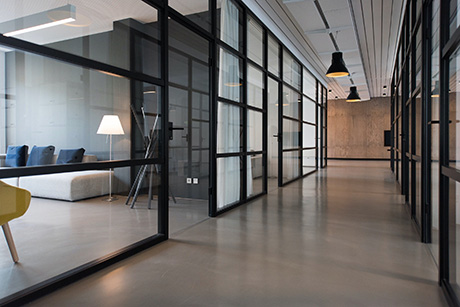
Office Overview: Tenant Efficiencies Heighten Trouble for Landlords
The drop in demand for North American office space deepened in 2023. Tenants in the United States shed 71 million square feet in 2023, slightly more than in the COVID lockdown year 2020, as a renewed focus on efficient use of space led to further footprint reductions and higher overall vacancy.
Since the beginning of 2020, U.S. net absorption has contracted by 188.6 million square feet. By comparison, absorption losses associated with the Great Recession totaled about 50 million square feet. Negative net absorption was 15,798,403 in the fourth quarter and negative 71,081,718 square feet for the year. The U.S. vacancy rate is at a record 13.7 percent, up 420 basis points since the pandemic hit. A recent Wall Street Journal headline summed it up: ‘The Office Market Had It Hard in 2023. Next Year Looks Worse.’
Given the clear trend that tenants are reducing footprints when choosing to renew their leases or relocate, the outlook is sobering. Since nearly half of office leases signed prior to the lockdown remain unexpired, the rate of vacant space could grow more than three percentage points by 2026. Leasing volume is down nearly 20 percent from its average in the late 2010s, driven by deal sizes that are 20 percent smaller. Sublease inventory is at 206 million square feet, down from its recent peak of 215 million square feet but more than double its previous highs.
The implications for property values are obvious. Currently, values are down 10-15 percent since the end of 2021. A small portion of the loss can be tied to the rising rates affecting all commercial property sectors. The remainder is the result of income loss due to vacancy. With higher vacancy rates and deteriorating rents, an added 25 percent value decline is in the forecast.
About 53 million square feet in new inventory was delivered in 2023 with about 15 million square feet being demolished or converted. The resulting 37 million square feet of deliveries were the least since 2014. The 30 million square feet in new starts in 2023 were the fewest since 2000.
Many landlords have been able to extend their loans, but many are losing hope that occupancy rates will begin to rebound. There will be pressure on landlords to pay off their mortgages, sell their properties at steep discounts or hand over the keys to their creditors.
With more than half of pre-2020 leases yet to roll and a steady stream of low-rate loans maturing into a high-rate environment, the office sector in most markets looks to be in for a protracted correction.
Retail Overview: North American Retail Vacancies Hit Record Lows

Photo by Alexander Kovacs on Unsplash.
Despite warnings of a softening economy, North American retail property generally performed well for investors in 2023 as steady consumer spending and tenant demand pushed vacancy rates to record lows, making quality space for lease harder to come by. Net absorption in the United States in 2023 totaled 52,778,097 square feet. Although growth was down nearly 30 percent from 2022, the overall vacancy rate fell to a record low 4 percent. Available space fell 200 basis points in 12 months. Annual rent growth was 3.3 percent, more than the 2.3 percent average for eight years prior to the lockdown. In addition to slowing activity, less than 50 million square feet of new space was delivered in the United States.
Leases for general retail space and space in neighborhood centers account for about 90 percent of current net absorption. Leasing activity is dominated by spaces of 3,000 square feet or less, which is overwhelmingly driven by growth from quick-service restaurants. The food-and-beverage sector accounted for nearly 20 percent of all leasing activity over the past year. Starbucks, Crumbl Cookies, Yum Brands and Restaurant Brands International, which owns BK, Tim Hortons, Popeyes and Firehouse Subs, signed for dozens of new locations across the country in 2023.
From a geographic perspective, the greatest uptick in demand for retail space has been seen in Sun Belt markets experiencing strong population and buying power growth. Leading the way in inventory-adjusted demand growth over the past year were Phoenix, San Antonio, Austin, Fort Lauderdale and Kansas City, as retail continues to follow rooftop growth. A primary driver of the restoration of fundamental balance within retail space markets has been the limited amount of construction activity across the country. New construction has primarily focused on build-to-suits, grocery-anchored centers or smaller retail spaces in large mixed-use projects. This helps explain the above-average leasing rates for new retail properties, as less than 20 percent of space delivered over the past year was available for lease at the end of the third quarter of 2023.
Any threat coming from new supply is expected to remain minimal for the foreseeable future. Only 55.4 million square feet of retail space is underway across the United States. Additionally, starts have been falling over the past year despite tightening fundamentals. While this appears to be inconsistent with typical behavior in a tight market, the recent rise in construction financing costs, coupled with record-high land and labor costs, often challenge the economics of new development. Thus, the recent decline in starts is likely to continue until new development pencils through a combination of moderating input costs and rising rents.

Photo by Anders Holm-Jensen on Unsplash.
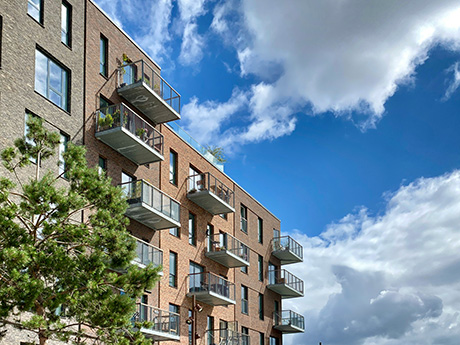
Multifamily Overview: Sun Belt Markets Oversupplied
The North American multifamily sector is a tale of two markets. The overall U.S. apartment market underwent four quarters of healthy net absorption in 2023 yet tenant growth still was 26 percent short of new supply, a trend in its ninth straight quarter. The added surplus pushed up the vacancy rate to 7.5 percent and rents went flat for the first time since 2008-09.
In the United States, there were 41,254 units leased in the fourth quarter, bringing total net absorption in 2023 to 329,313 units, a 95 percent increase from 169,059 units in 2022. Vacancies are up in premier properties due to overbuilding in many markets. Higher rents and economic uncertainty are depressing new lease signings in Class B and C properties.
The supply-demand imbalance has been greatest among Class A properties in the Sun Belt markets. For example, the vacancy rate in Raleigh rose from 7.7 percent to 11 percent in 12 months, while the rate of Class B and C vacancies surged by 520 basis points to 14.2 percent. In Jacksonville, Fla., the vacancy rate among premium units rose by 480 basis points in the past four quarters to 12.7 percent.
Sun Belt properties no longer see the strongest rent growth, as several of the former fastest-growing markets have experienced significant deceleration. Metros with the strongest rent growth in 2023 were Cincinnati, Northern New Jersey, Chicago, Indianapolis, Columbus and Boston. At the same time, Austin and Atlanta have seen year-over-year rents decline by 4.8 percent and 3.1 percent, respectively. That’s a sharp contrast to the 20 percent plus rent growth both markets saw in late 2021.
Palm Beach saw the steepest rent slowdown in the nation over the past seven quarters. Annual rent growth there fell from 28 percent at the end of 2021 to 0.3 percent in the third quarter of 2023. Similarly, rent growth in Las Vegas slowed from 21 percent to minus 2.5 percent over the same period. Midwest and Northeastern markets avoided the sharp reversal of rent growth seen in Sun Belt locations as their construction pipelines remained modest during the pandemic. Projected deliveries in the Midwest in 2023 were only about 5,500 units more than 2019 deliveries.
Vacancy held steady or near steady year-over-year at 6.8 percent in Minneapolis, 6.6 percent in San Francisco and 5 percent in San Jose as net absorption hewed closer to supply additions. Sixteen markets hit record deliveries in 2023 with about two-thirds of these in the Sun Belt. The proposition that office buildings can be converted into apartments has received more attention than it is worth. Only a small percentage of buildings are suitable for conversion and estimates show only about 10,000 new units will be created this year.
— Lee & Associates Research Department. Lee & Associates is a content partner of REBusinessOnline. To read all of 2023 Q4 North America Market Report, click here.
Industrial photo Point3D Commercial Imaging Ltd. on Unsplash.


