


The Lee & Associates’ 2026 Q2 North America Market Report finds that commercial real estate fundamentals are improving, but the pace of recovery varies significantly by property type and market. Office and retail sectors are showing renewed momentum, industrial demand continues to recover unevenly amid trade uncertainty and multifamily fundamentals are stabilizing as new supply begins to moderate. Across all sectors, investors and occupiers remain highly selective in an evolving market.
Sponsored: Download Lee & Associates’ 2026 Q2 North America Market Report.
Industrial Overview: Recovering Demand Is Uneven Amid Trade Tensions
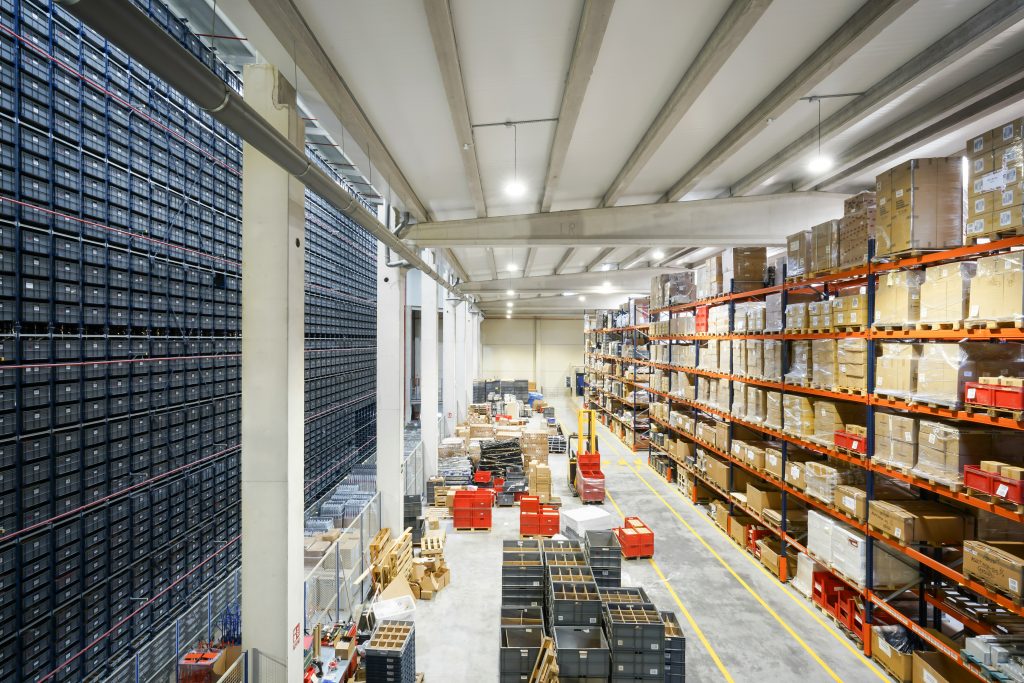
Demand for North American industrial space in the second quarter continued to recover from slowing caused by heightened trade uncertainties that began early last year. Modest tenant expansion in the United States remains well off pre-COVID average growth. In the United States, 44.4 million square feet of net absorption in the second quarter brought the mid-year total to 77.1 million square feet, about 30 percent less than the pre-pandemic five-year average.
First-half deliveries fell to 93 million square feet, which included 44.4 million square feet in the first quarter — the least in seven years. Although supply additions have moderated, the pullback in tenant demand over the past three years has produced a supply overhang, particularly in many trade-dependent markets. The leading markets in net absorption over the past 12 months included Dallas-Fort Worth with 28.7 million square feet, 23.5 million square feet in Phoenix, 18.3 million square feet in Houston, 15.5 million square feet in Indianapolis and 12.7 million square feet in Columbus.
The overall vacancy rate ticked up slightly to 7.5 percent in the second quarter. Vacancy rates averaged more than 9 percent for logistics buildings and less than 5 percent for smaller buildings up to 50,000 square feet and typically without dock-high loading. Some of the most acute shortages of small bay space are in Tampa, Charlotte, Nashville, Jacksonville and Orlando, where demand for home improvement goods and services, such as floor coverings, cabinetry and HVAC, is up from increased migration from the Rust Belt.
Major markets with the least empty space at the end of the second quarter were Cleveland at 4.4 percent, followed by 4.9 percent in Detroit, 5.4 percent in Chicago, 5.5 percent in Pittsburgh and St. Louis, 6.4 percent in Columbus and 6.5 percent in Los Angeles and Orange County. Markets with the highest vacancy rates included Austin at 14.3 percent; San Francisco, 12.5 percent; Phoenix, 10.5 percent; Seattle, 10.1 percent; and 9.8 percent in Charlotte. Due to elevated vacancy and slower leasing, year-over-year rent growth has slowed to 1.3 percent, its lowest rate since 2012.
Although deliveries peaked in late 2023 with nearly 291 million square feet of new space in the second half, several Sun Belt and Midwest markets with fewer development constraints remain part of a record supply wave that could take more than two years to absorb. Austin, Indianapolis, Greenville/Spartanburg, Phoenix and San Antonio stand out as markets with risks of prolonged higher availability rates, particularly among logistics properties up to 500,000 square feet.
Office Overview: Healthy Growth in Strongest Market Since COVID
The North American office market is having its best year since the COVID lockdown, punctuated by vacancy declines in the second quarter across the United States for the first time since 2019. Tenant growth has returned and institutional investors are showing greater confidence in premium assets. Also, with little new space being built and more obsolete office properties being redeveloped, total inventories in the United States declined.
The turnaround in the U.S. office market over the last four quarters has totaled 29.7 million square feet. Following healthy first-half net growth of 16.7 million square feet, the U.S. market is on track in 2026 to halt its six-year slide in tenant expansion totaling negative 227.6 million square feet. Not all metros are reporting strong performances, however. New York City, Dallas, Austin, Houston, San Francisco and San Jose are surging, while Los Angeles, Chicago, St. Louis and Washington, D.C. still seek stability.
First-quarter sales volume was the most in four years, with more than $13 billion in transactions in part as landlords and lenders accept COVID-era losses more willingly. Private investors were represented in almost half of the deals and users accounted for about 20 percent. Institutional buyers accounted for nearly a quarter of the sales volume, a notable uptick.
There is an abundance of distressed properties in undesirable locations with some marked down more than 90 percent. Average values of high-quality properties have fallen about 35 percent. Meanwhile, there are owners of premium office towers in the best locations of New York City and the hottest parts of San Francisco that are raising rents and making profitable trades. Additionally, the gap between winners and losers is widening as tenants migrate toward quality. About two thirds of traditional buildings are at least 90 percent occupied and collectively contain less than 5 percent of all vacant space. By contrast, nearly 80 percent of vacant space is in buildings less than 75 percent occupied. These buildings represent 21 percent of inventory.
Further complicating the narrative are inconsistent attributes defining the most desirable spaces in various locales. In New York, for example, well-located Class B buildings have been backfilling for more than a year. Meanwhile, comparable buildings in other markets remain essentially unleasable. Leasing volumes remain depressed in many markets, including Atlanta, Chicago, Los Angeles, Seattle and Washington, D.C., and tenant composition has changed dramatically. Some 31,000 leases executed in the first quarter were the most in a decade, but the lease size averaged 15 percent less than before COVID, a geographically persistent trend.
Conversions of office space to more than 90,300 apartments were estimated by data firm RentCafe to be underway nationwide at the start of the year, a 28 percent jump from a year ago. New York City buildings lead the list at 16,300 apartments followed by Washington, D.C., with 8,479 conversions and 4,360 in Chicago.
Retail Overview: Strong Demand, Low Vacancies; Property Sales Surge
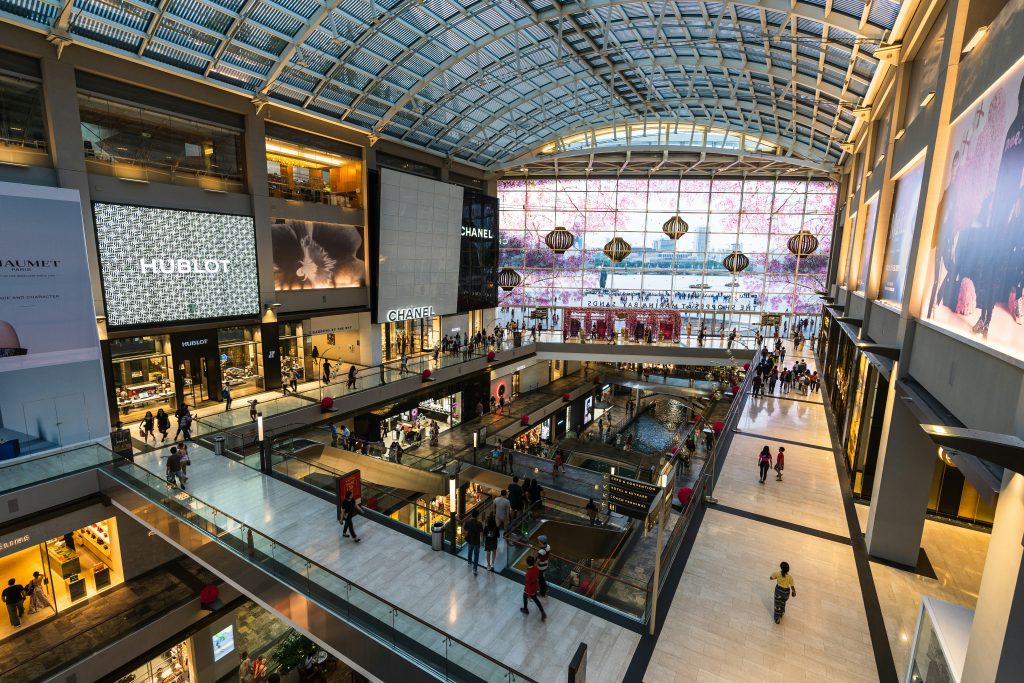
North American retail property markets continued to show resilience in the second quarter that is generally well-supported by solid operating fundamentals and limited new supply. Although rent growth has been moderating, investors have been active with property sales running more than 30 percent ahead of last year.
The overall retail market in the United States remained broadly balanced in the first half with strong merchant demand returning in the second quarter that was reflective of seasonal dynamics in a cautious operating environment. Net retail expansion totaled 5.4 million square feet in the second quarter, a turnaround from 4.7 million square feet of negative absorption in the first quarter and the third contraction in five quarters. The decline was driven by a spike in move-outs, which rose to approximately 103 million square feet as the calendar year turned over.
Nevertheless, vacancy held steady in the second quarter of 2026, remaining within 40 basis points of the record low in late 2023. The general retail category, with 55 percent of the 11.7-billion- square-foot inventory and freestanding tenants from restaurants to car dealers, also has the lowest vacancy rate at 2.7 percent. Grocery-anchored neighborhood centers make up nearly 25 percent of retail space and average 6.5 percent vacancy. Malls, power centers and strip retail account for the balance.
Neighborhood centers were hit hard last year by nearly 12,000 closings, including 1,250 Rite Aids, 800 Joann stores, 500 Big Lots, 450 Walgreens, 600 Starbucks, 370 Family Dollar stores and 95 Dollar General stores. Early-year move-out totals typically are elevated and make the first quarter the weakest of the year. The weakness this year was amplified by the large closures and more mom-and-pop tenants folding, consistent with slowing discretionary sales and rising operating costs. Leasing activity remains dominated by small-format and inline space. Spaces less than 2,500 square feet continue to account for a larger share of transactions.
First-quarter 2026 sales volume increased 31 percent from a year ago and exceeds pre-COVID levels. Banks reported stronger demand for loans alongside modestly relaxed underwriting standards. Over the past four quarters, retail sales activity has been led by coastal markets and the Sun Belt. Los Angeles and New York posted more than $4 billion in transaction volume followed by more than $3 billion in Chicago. Atlanta, Phoenix, the Inland Empire, Miami and Detroit each exceeded $2 billion in sales.
Multifamily Overview: Vacancy Dips on Q2 Demand; Flat and Falling Rents
Apartment vacancy fell across North America in the second quarter as the United States reported demand from tenants taking advantage of little to no rent growth. After a modest first-quarter gain with net rentals up by 76,145 units in the United States, stepped-up second-quarter demand produced a mid-year total of 255,162. Coupled with fewer deliveries, the rebalanced inventory of 20.9 million units brought the vacancy rate down 30 basis points to settle at 8.2 percent. Seventy-eight percent of units rented were premium apartments.
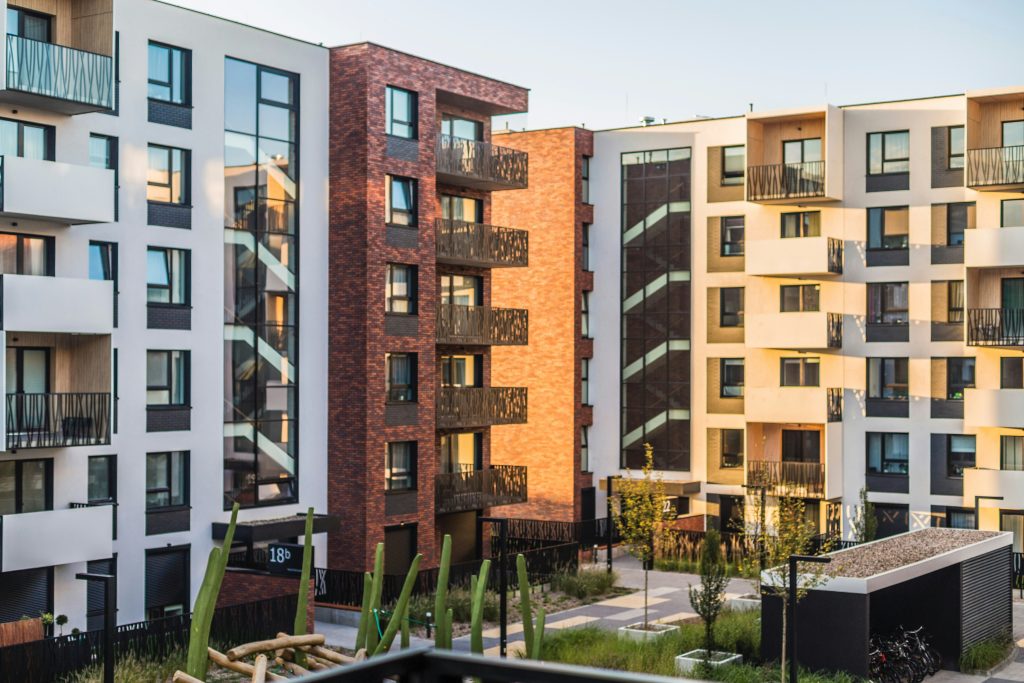
Despite the healthy demand, conditions remain soft. Fueled by low capital costs and strong COVID-era migration demand, developers pushed supply to a 40-year high in 2024, with annual net deliveries peaking at more than 690,000 units in the fourth quarter.
Annual supply fell by 24 percent in 2025 to approximately 529,000 units and is expected to decline by 27 percent in 2026 to approximately 385,000 units, the fewest since 2019. Vacancies are rising most in the South and Mountain regions, where new supply has been concentrated, while Midwest and Northeast markets remain more balanced.
In many markets rent concessions are on the rise, particularly among Sun Belt properties, where the demand from remote workers caused a spike in new starts of premium projects. But last year’s slowing job growth forced landlords to make concessions to stabilize their rent rolls. Allurements include a month or more of free rent, free movers and concert tickets.
Metros where landlords are offering concessions on roughly half the available units are led by Phoenix, followed by Denver, Charlotte, Austin, San Antonio, Raleigh, Jacksonville, Tampa, Nashville and Las Vegas.
Twenty-one of the top 50 markets posted negative rent growth in the second quarter of 2026, and 44 have slowed in the second quarter compared to the same period last year. This broad-based deceleration underscores the impact of elevated supply and easing demand across a wide swath of the country. Austin and San Antonio are posting the steepest declines, both down 3.3 percent, followed by Denver, which has fallen 3.1 percent. Rents declined 2 to 3 percent in Las Vegas, Phoenix and Tampa.
— Lee & Associates Research Department. Lee & Associates is a content partner of REBusinessOnline. To read all of the 2026 Q2 North America Market Report, click here.