

Lee & Associates’ 2025 Q3 North America Market Report examines a commercial real estate landscape experiencing some pauses as the effects of exogenous forces work their way through the market. Economic and legal questions, the second- and third-order effects of tariffs, persistently high costs, unemployment concerns and the new realities of artificial intelligence (AI) have combined to produce mixed results across all property types.
Demand for office and retail has increased (and their respective pipelines remain constrained). Of the four property types covered in the report — industrial, office, retail and multifamily — only retail saw transaction momentum in the previous quarter.
Meanwhile, the overbuilt industrial and multifamily sectors have witnessed weakening or negative demand in the third quarter.
Lee & Associates’ full, detailed market report is available to read here. The overviews for the sectors below reveal a market that seems to be holding its breath, awaiting new information.
Industrial Overview: Markets Await Tariff Clarity
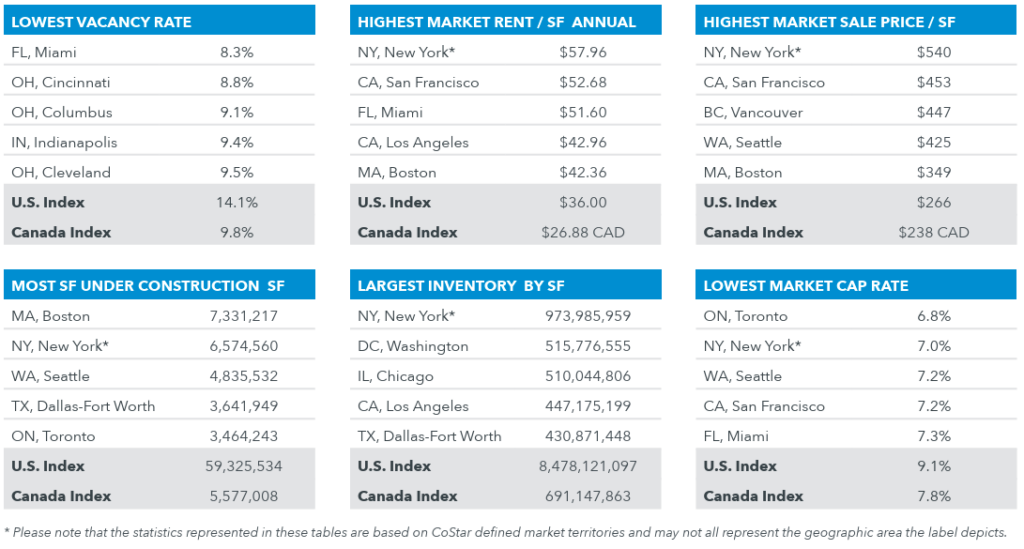
Net absorption of industrial space increased in the third quarter across North America, but demand was weak and failed again to keep pace with the supply of new buildings, while tenant growth remained hobbled by tariff concerns and interest rates.
In the United States, following 8.1 million square feet of negative absorption in the first half, third-quarter tenant growth totaled 31 million square feet. That was off 41 percent from a year ago, and the 22.8 million square feet year-to-date growth was off 70 percent compared to the first nine months of last year.
In the U.S. the increased net absorption also will be outweighed by the estimated 233.5 million square feet of space slated for delivery this year, which follows a three-year, 1.4-billion-square-foot construction boom.
The combination of tenant contraction and added supply drove up the vacancy rate 70 basis points from the second quarter to 7.5 percent, the highest since 2013 in the aftermath of the Great Recession. Impending supply additions are forecast to push vacancy higher.
As property owners increasingly offer concessions, free rent is strategically favored by most landlords — typically one month of free rent per year. The reduced “effective” rental rate can translate into a 5 to 8 percent savings for the tenant. Meanwhile, landlords theorize that after the free rent is used in the first year, the property’s full value will be restored for the remainder of the lease.
High vacancies have hit larger buildings in recent years. Since 2022, vacancy in buildings larger than 100,000 square feet is up 380 basis points to more than 8 percent. Buildings from 50,000 to 100,000 square feet have seen a more gradual rise, increasing 240 basis points, to 5.7 percent. Buildings smaller than 50,000 square feet are in most demand and with vacancy typically at less than 5 percent.
Meanwhile, ongoing trade uncertainty poses a great risk as business leaders struggle to plan for growth. The federal government has reached preliminary agreements with the European Union and only six other trading partners. The current tariff truce with China is under stress due to China’s restrictions on its rare-earth materials.
Complicating matters is whether the administration’s trade policy will satisfy a majority on the U.S. Supreme Court. The court this term will consider President Trump’s appeal of a lower court’s denial of his claim to emergency powers to make trade agreements without Congress. The ruling against the government by the U.S. Court of International Trade was affirmed in August by a federal appellate court.
Office Overview: Demand Returns to Unsteady Markets
Tenant demand returned to North American markets in the third quarter, reversing earlier declines as the uncertain office recovery struggles with fits and starts against a backdrop of tariffs and looming AI.
There were 12 million square feet of net absorption in the United States in the third quarter. The surge brought year-to-date net growth to negative 4.8 million square feet, the lowest total through the third quarter since the COVID lockdown. The overall vacancy rate ticked downward from the second quarter’s record high to settle at 14.1 percent.
In the United States, the economy appears to have gathered some strength in the third quarter with stronger consumer spending and a boost in business investment in AI-related equipment. This equipment includes specialized computer chips and hardware made by NVIDIA, Google and others that are designed to efficiently process AI workloads.
Only about half the 80 major metro areas surveyed have posted occupancy gains in the last 12 months. Atop the list, with six straight quarters of net tenant growth, is New York City with 7.9 million square feet.
Other markets showing the most tenant growth in the last 12 months are Dallas/Ft. Worth’s 3.6 million square feet, 1.5 million square feet in Phoenix, 1.3 million square feet in Charlotte and 844,343 square feet in Houston.
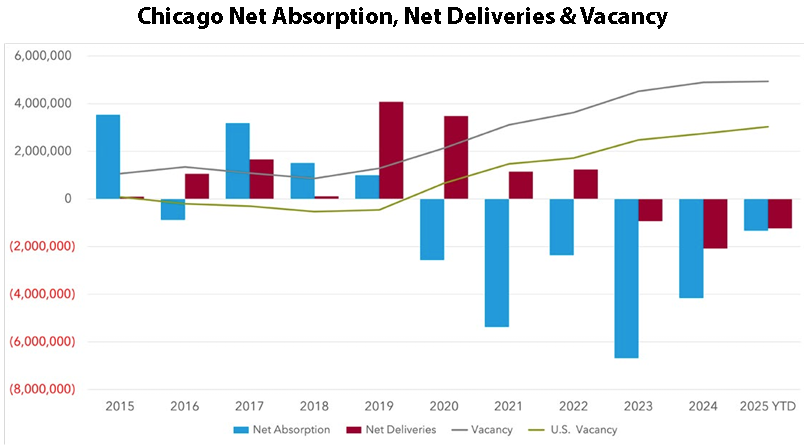
Absorption also has turned positive in beleaguered San Francisco, which reports net absorption of 369,581 square feet. Other metros, however, remain plagued by givebacks. Leading that list of negative 12-month totals are Chicago, which was 3.9 million square feet in the red, followed by negative 3.6 million square feet in Washington, D.C., 2.8 million square feet in Boston, 2.2 million square feet in Denver and 2.1 million square feet in Los Angeles.
Working against the office recovery is the stalling job market. Government reports and revisions show payrolls 2 percent below their 2023 peak in the major so-called knowledge industries that include work in technology and information, life sciences, professional and financial services, advanced manufacturing, creative and media.
Meanwhile, supply growth is down to a trickle in the United States this year, along with a construction pipeline that’s empty.
In the United States, through the first three quarters of 2025, slightly more than 25 million square feet were completed. After demolitions, the net inventory only increased about 8 million square feet. Some 9 million square feet are set for delivery in the final quarter of 2025.
By comparison, over five years prior to the COVID lockdown, annual deliveries averaged 68 million square feet. The office market was also posting strong fundamentals in vacancy, restrained supply levels, leasing activity and demand with 40 straight quarters of growth.
Retail Overview: Trading Jumps on Sound Fundamentals
North America’s retail real estate markets overall are sound fundamentally at the moment with generally healthy demand, low vacancy rates, healthy rent growth and constrained supply. Given the reduction in transaction activity besetting other commercial real estate categories, retail has re-emerged as a preferred asset class.
In the United States, transaction momentum continued with $10.2 billion in property trades in the third quarter of 2025 and $47.8 billion year to date, a 31 percent increase compared to a year ago. Investors are appreciating the broad retail landscape, looking beyond a recent spike in available space from the latest wave of bankruptcies and closures to register with U.S. markets.
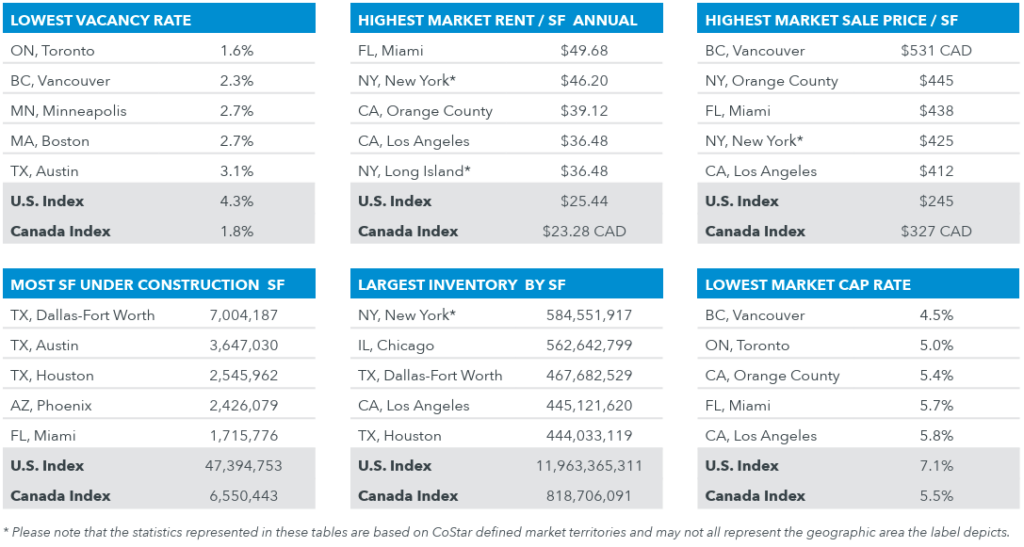
Across the United States, there was a 20-basis-point uptick in the first half vacancy rate with closures by Joann, Forever 21 and Rite Aid. But healthy merchant demand of 4.8 million square feet returned in the third quarter, lifting the year-to-date total of net absorption to negative 11.1 million square feet, the weakest since the 2020 lockdown. Nevertheless, overall U.S. availability remains nearly 15 percent less than the prior 10-year average, underscoring the sector’s long-term tightening and the resilience of underlying fundamentals.
Through the first half of this year, U.S. starts fell to a historic low, while space underway dropped to less than 50 million square feet for only the fourth time on record. The economics of new development remain challenging, with rising costs outpacing achievable rents. Also, strong demand for alternative uses such as multifamily, industrial and mixed-use raises the opportunity cost of pure-play retail.
Retail sales — excluding e-commerce, gasoline and cars — have increased by more than 30 percent on a nominal basis since the end of 2019. Revised data for the first half shows inflation-adjusted household spending growing by 2.7 percent. But real consumption has been flat recently, as consumers contend with elevated prices and moderating income growth. While no longer rising, delinquency rates for credit cards and personal loans remain elevated.
Looking ahead, near-term rent growth likely will slow as backlogged space from recent closures is leased up. Given the persistent shortage of quality inventory and limited construction, much of this space is expected to backfill relatively quickly. Investors, managers, tenants and brokers complain about the lack of quality available space. After four years of consecutive growth, availabilities skew to the lower end of the quality spectrum, with Class C space accounting for nearly 40 percent of inventory. Less than a quarter of available space was built in this century.
Multifamily Overview: Demand, Rent Growth Cools
Demand for apartments in the United States cooled in the third quarter but remained healthy. Third-quarter net absorption totaled 137,735 units. It was the seventh straight quarter of 100,000-plus units of tenant growth but down 24 percent compared to the third quarter of 2024 and off 16 percent year to date. Asking rents are up an average of 0.6 percent year to date, the weakest growth rate since 2009.
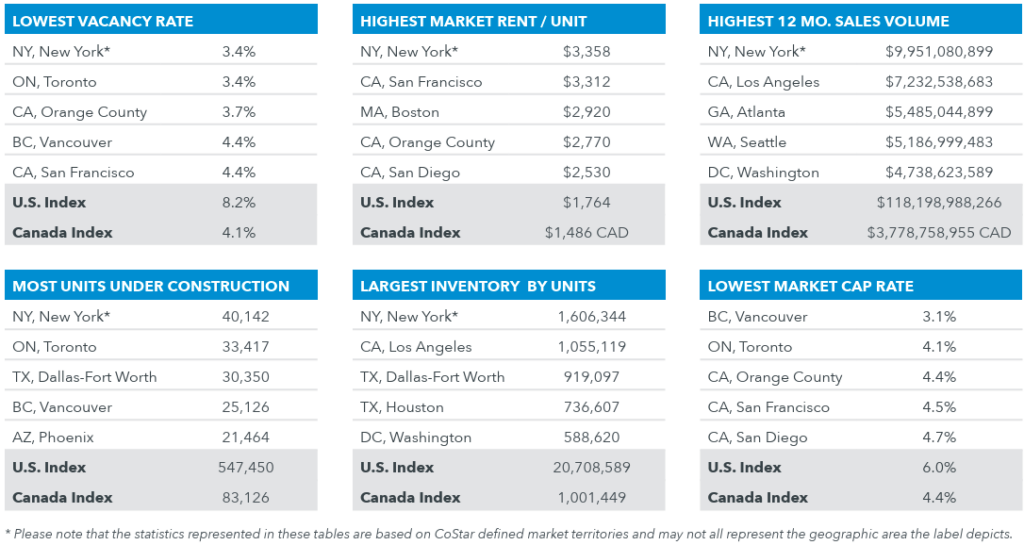
The pace of inventory expansion has slowed in the United States after a wave of new development across the South and Southwest — driven by domestic migration and low capital costs — hit a 40-year-high before cresting late last year. The third-quarter total was 20,708,436 units. The 145,886 units added in the third quarter of this year totaled 19 percent less than last year, and the 417,843 units added year to date were down 16 percent from 2024. By 2026, the annual supply growth is scheduled to fall to some 260,000 units, the least since 2014.
Overall U.S. vacancy has held steady this year at about 8.2 percent. Vacancies in 27 of the top 50 markets declined in the third quarter, led by Austin with a 70-basis point drop. Pittsburgh, Charlotte and Milwaukee each posted more than 50-basis-point declines. Other top third-quarter markets included New York City, Dallas and Phoenix. Reduced supply growth in the coming quarters should enable absorption to chip away at the nation’s elevated overall vacancy rate.
The construction pipeline is thinning. Deliveries are projected to drop by half over the next 12 months. The national vacancy rate will begin to edge downward, leading to many markets posting gradual rent growth gains in 2026. Construction starts have fallen to a decade-plus low due to extended lease-periods, higher costs of capital and tightened lending policies.
The pullback in new supply could allow many overbuilt Sun Belt markets to begin absorbing excess inventory, stabilize vacancy rates and return to positive rent growth by mid-year 2026. For example, supply growth this year will fall 40 percent in Atlanta and 35 percent in Phoenix.
— Lee & Associates Research Department. Lee & Associates is a content partner of REBusinessOnline. To read all of the 2025 Q3 North America Market Report, click here.
Industrial photo by CHUTTERSNAP on Unsplash.