

Interest in affordable paths to homeownership and the growing popularity of lower density living are raising the profile of the manufactured housing option among American households and investors. At the same time, the government sponsored enterprises (GSEs) Fannie Mae and Freddie Mac are making concerted efforts to better serve this historically underfinanced market at both the individual homeowner and community levels.
The combination of robust cash flow growth (particularly in Sunbelt and Western markets), cap rate compression, and liquidity provided by the GSEs makes a compelling case for manufactured housing community (MHC) acquisitions and refinances. As increased competition has left market participants looking for an edge amidst compressing cap rates, the importance of working with an experienced MHC lender with access to short- and long-term loan programs has become more apparent. The following provides an in-depth analysis of the recent performance of rental MHCs, sales volume and pricing trends, and loan and underwriting trends in the MHC space.
The Performance of the Site Rental Market
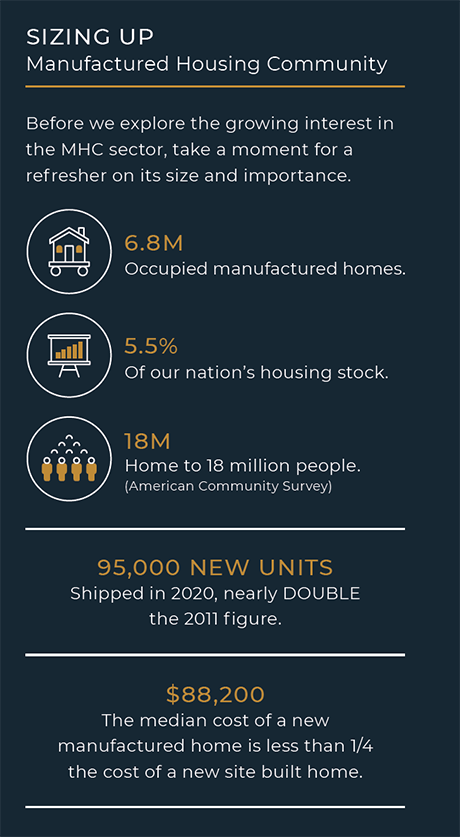
The COVID-19 pandemic affected American housing preferences in profound ways. Increasingly, households are seeking lower density options with larger floor plans, home offices, and dedicated space for entertaining or distanced learning. This phenomenon accelerated pre-existing migration trends favoring smaller cities and Sunbelt states and catalyzed the advancement of newer industries – including modular homes and single-family rentals. It also elevated the manufactured home option as an affordable ownership option within reach of most families. Consequently, demand for MHC site rentals has increased.
Indeed, mobile home sales1 and internet traffic to websites that provide referrals to MHC sites increased during the pandemic. Visits to a popular referral website2 increased more than 20 percent during the first months of the pandemic, and another 8 percent from October to March. Moreover, net absorption of MHC sites and rental units appears to have surged more than 400 percent during the 12 months ended March 2021 as compared to the prior year.
Occupancy Trends
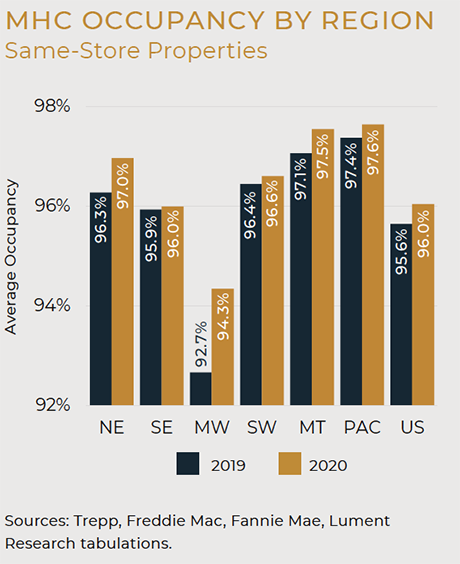
Rising demand for a limited supply of space3 typically leads to increased occupancy, and the manufactured housing market is no exception. Available data suggest that occupancy in the GSE financed segment of this asset class has risen consistently for years and currently approaches 96 percent. For purposes of evaluating asset class performance, the Fannie Mae DUS® and Freddie Mac Optigo® portfolios represent the largest samples and most reliable and consistent MHC performance data. In June, the sample consisted of nearly 2,600 properties, roughly 20 percent of the MHC universe of properties valued at $1 million or greater.

A subset of 877 properties was identified from which continuous performance data were collected since 2018. The value-weighted average year-to-date 2020 occupancy rate of the same-store subset was 95.2 percent, comparing favorably to 91.2 percent at origination and 94.6 percent and 95.2 percent in 2018 and 2019, respectively, demonstrating steady improvement in recent years. Among a larger 1,219 same-store sample of portfolio properties with observations for 2019 and 2020, the value-weighted occupancy rate was 96.1 percent in 2020, up from 95.6 percent in 2019.
For purposes of assessing metro level performance, we narrowed the MHC universe to the 31 largest metropolitan markets by number of communities for which a robust data set is available. This group encompasses nearly 10 percent of the universe of larger communities and sites. The sample is concentrated in California, Florida and Texas, with smaller clusters in the Midwest and Pacific Northwest.
Findings indicate that average site occupancy in the 31 markets stood at 95.1 percent during the first quarter 2021, representing the highest metric recorded in the past five years. Indeed, the latest datum is likely the highest occupancy level observed in this sector since the 1990s. Quarterly data show that average site occupancy increased throughout the pandemic, rising about 40 basis points (bps), or 0.40 percent, during the first half of 2020, and another 65 bps in the nine months ended in March 2021. Interim spring reporting indicates that gains continued in April and May.
 The largest rate gains were chalked in metros with above-average site availability (Atlanta, Indianapolis, and Detroit), low-density markets located within short distances of high-cost California cities (Inland Empire, Sacramento, and Las Vegas), and affordable low-tax retirement destinations (Jacksonville, Tampa). Markets characterized by high site rents (San Jose, Sarasota, Chicago and Austin) recorded the only year-on-year occupancy decreases in the sample.
— By Daniel J. Hogan, Lument (formerly, ORIX Real Estate Capital) Managing Director for Research. Lument is a content partner of REBusinessOnline. The views expressed herein are those of the author and do not necessarily reflect the views of Lument or of the author’s colleagues at Lument.
For Lument’s whitepaper, click here.
- Shipments of new manufactured homes in 2020 totaled 95,000 units, well below the 350,000-unit 1999 peak, but nearly twice the comparable 2011 figure and an increase of 17 percent from 2016. Sales in January 2021 proceeded at a 106,000-unit seasonally adjusted annual rate, the fastest monthly pace in nearly four years.
- https://www.mhvillage.com/.
- Although consumer interest in this affordable ownership vehicle is on the upswing the national pad inventory is shrinking on the margin. Legacy communities have been converted to higher value residential and commercial real estate purposes in some instances, and zoning challenges and land costs place nearly insurmountable obstacles before new pad construction.